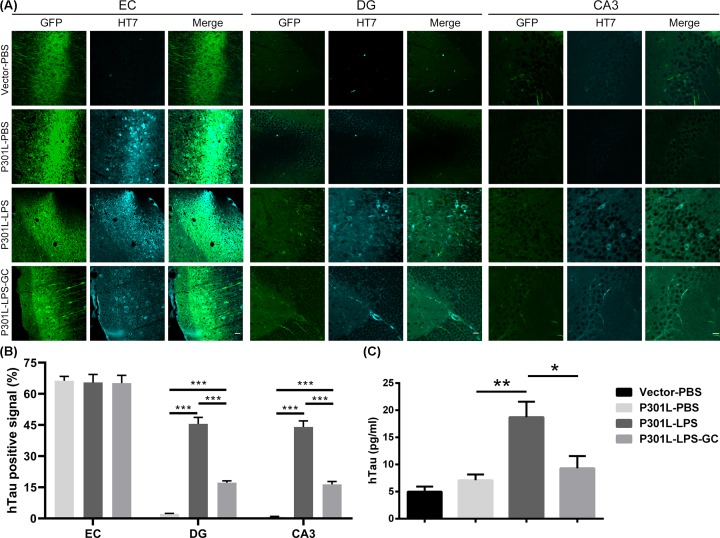
Figure 3. Chronic low-dose LPS induces P301L-hTau spreading from EC to hippocampus and GC attenuates the transmission.
(A) Mice were treated as described in Figure 2. After behavioral tests, the mice were killed and the brain slices were subjected to immunofluorescence for GFP (green) and HT7 (specific to hTau, cyan) in EC, DG and CA3. EC scale bar, 50 μm; DG and CA3, scale bar: 20 μm. (B) Quantification of hTau positive signal (HT7) in EC, DG and CA3. Data were presented as mean ± SD (n = 3 each group, two-way ANOVA followed by Tukey post hoc test). ***, P < 0.001. (C) The interstitial fluid level of hTau at DG subset was significantly increased in P301L-hTau-LPS group while GC attenuated the elevation of hTau in the interstitial fluid collected by microdialysis and analyzed by ELISA. Data were present as mean ± SEM (n = 7∼10 each group, one-way ANOVA followed by Bonferroni post hoc test). *, P < 0.05. **, P < 0.01.

