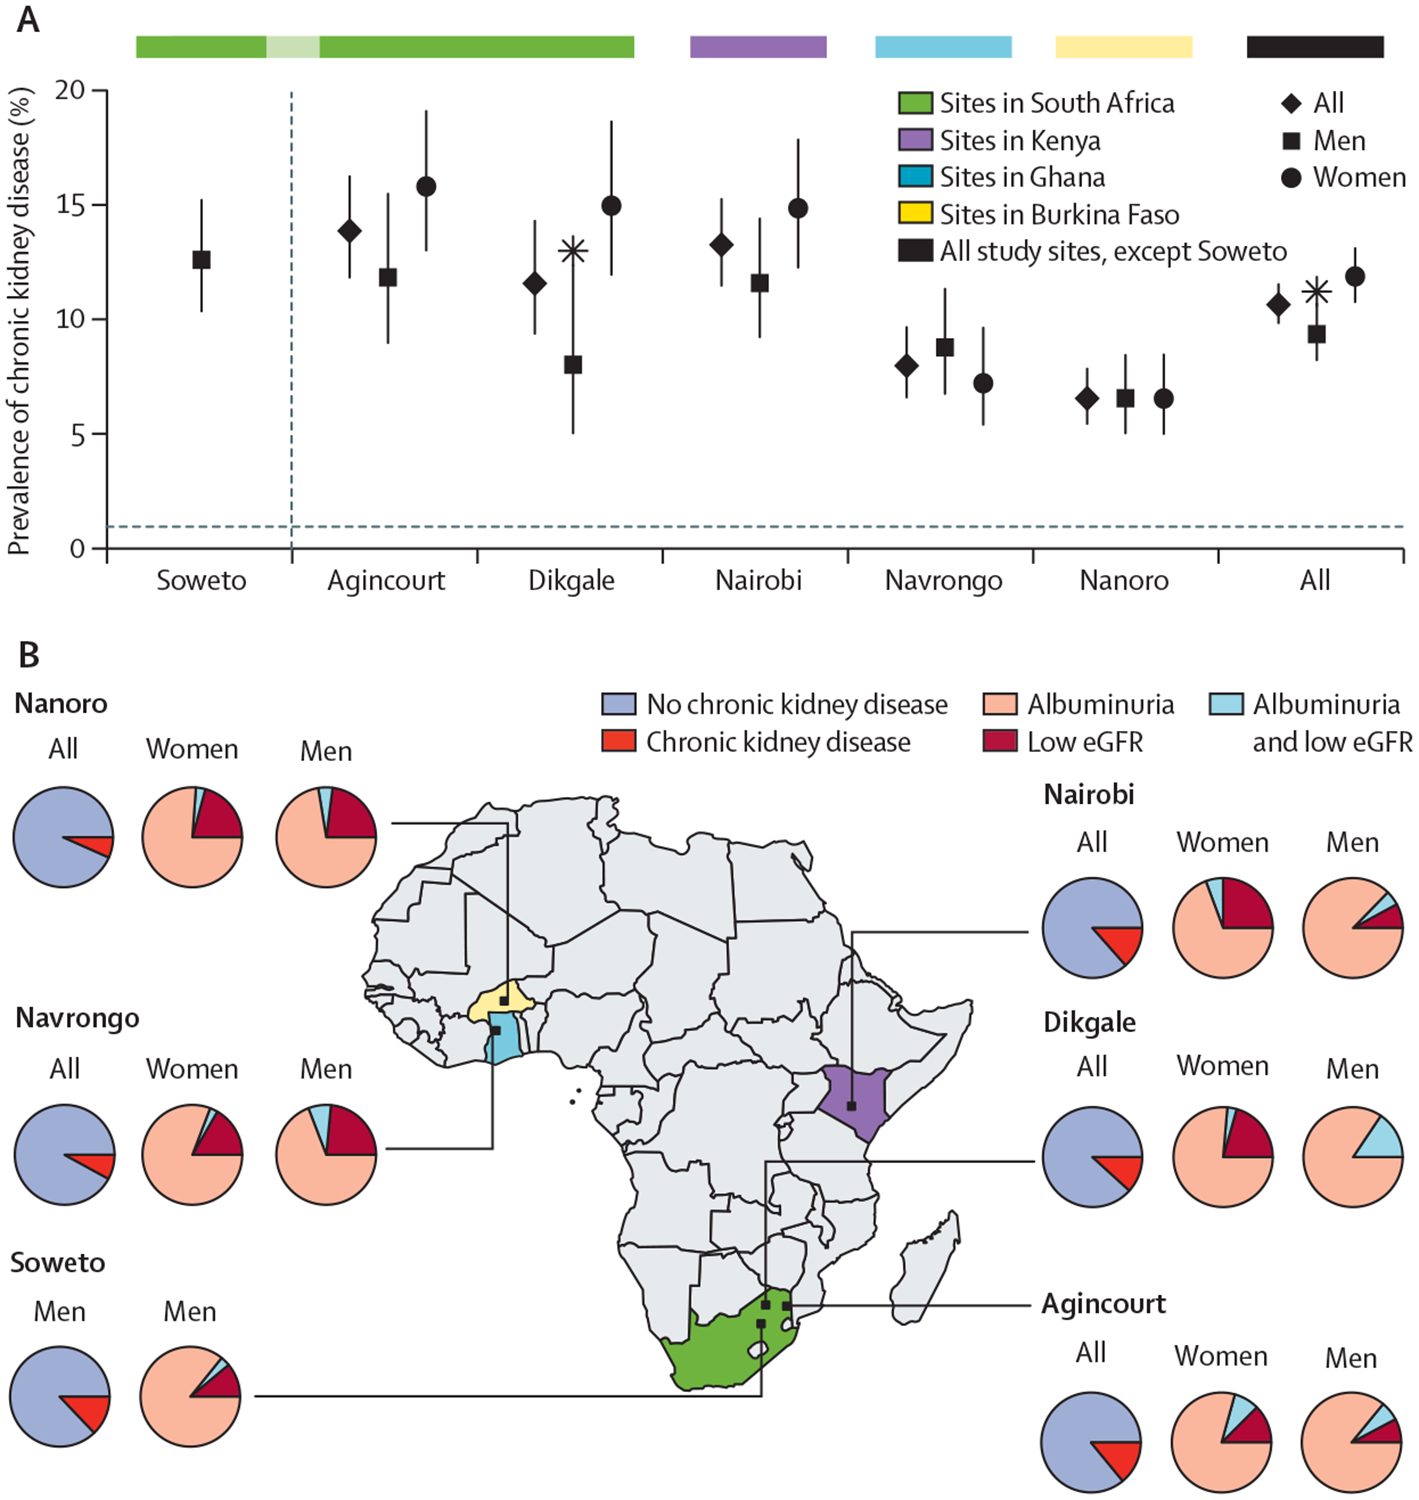
Figure 2: Prevalence of chronic kidney disease in four sub-Saharan African countries.

(A) Prevalence of chronic kidney disease, by sex and study site, with 95% CIs shown as error bars and significant differences (p<0·05) between men and women, adjusted for age, are shown by stars. (B) Map of Africa showing the locations of the study sites, with the proportion of the population with chronic kidney disease shown in the pie charts. The pie charts labelled women and men show only the individuals with chronic kidney disease from each of the study sites and the relative proportions with low eGFR or albuminuria, or both. eGFR=estimated glomerular filtration rate. Significant differences (p<0·05) between men and women, adjusted for age.
