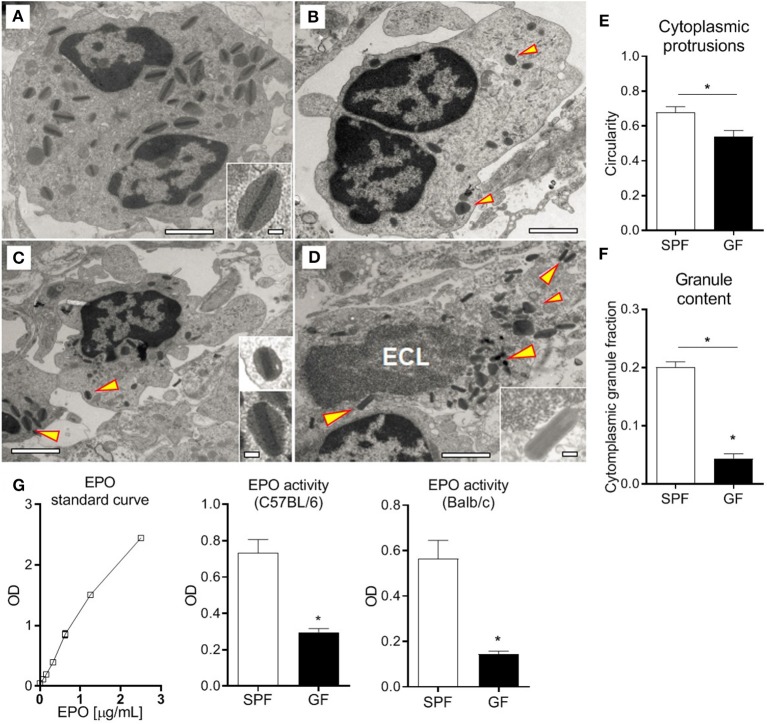
Figure 5.
Normal SI eosinophils transmission electron microscopy ultrastructure (A), showing bi-lobed nuclei and a high density of granules composed of an electron-dense core surrounded by an electron-lucent matrix rich in EPO (arrowhead). SI eosinophils from GF mice (B–D) exhibit cytoplasmic protrusions, measured as reduced circularity (E), lower content of cytoplasmic granules (F) and, occasionally, ECL signs (D). Assessment of EPO in intestinal homogenates of SPF and GF mice (G). Representative (A–D) and pooled (E,F) data from 6 mice, and pooled data from 2 independent experiments (n = 6) (G) represented as mean ± SEM, *P < 0.05.

