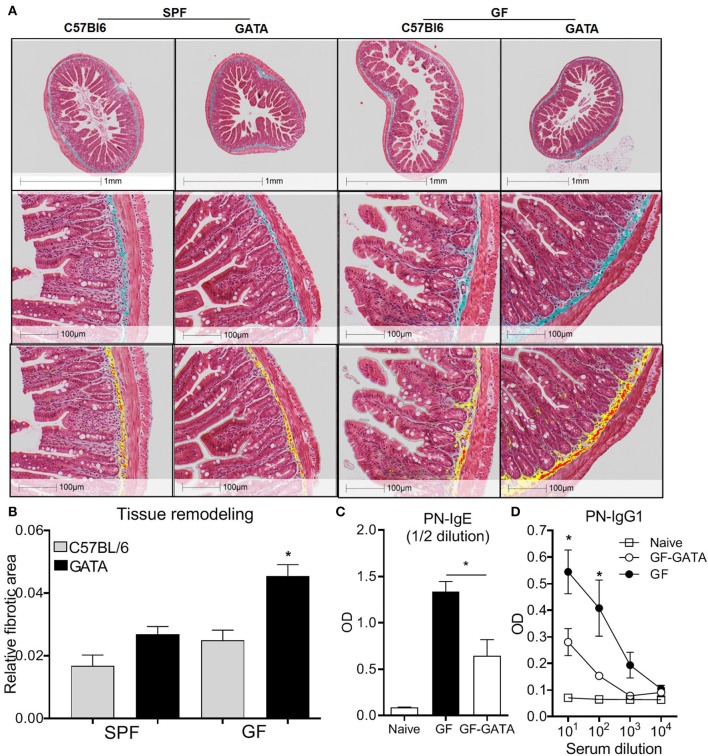
Figure 6.
Representative histological examples of intestinal fibrosis (A, upper panels) and associated Halo quantification of fibrotic surface on digitalized (20X) sections where yellow and red represents Masson's Trichrome positive stain (A, lower panels) and associated quantification (B) of overall fibrotic area performed on GF mice, eosinophil deficient GF mice (GATA-GF) and controls. GF mice, eosinophil deficient GF mice (GATA-GF) and controls were intragastrically sensitized to peanut (PN) and serum levels of PN-specific IgE (C) and IgG1 (D) were determined by ELISA. Data from 4 to 5 mice (A,B) or pooled data from 2 experiments (n = 6) (C,D) represented as mean ± SEM, *P < 0.05.

