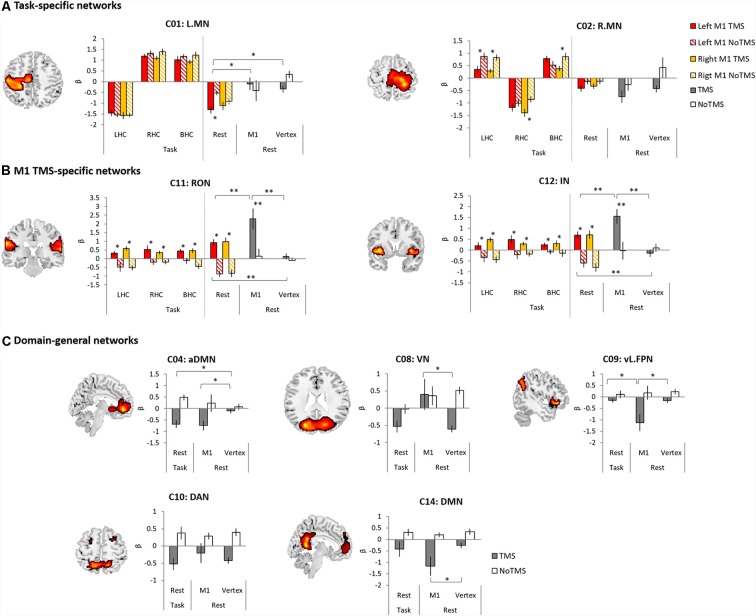
Figure 5.
The results of temporal regression analysis between groups. (A) Task-specific networks. (B) M1 TMS specific networks. (C) Domain-general networks. The bar filled color indicates the TMS phase and the bar filled with diagonal lines indicates the No TMS phase. Red (left M1 TMS) and Yellow (right M1 TMS). Gray bar indicated TMS phase and white bar indicate NoTMS phase. Error bars indicate standard errors. *p < 0.05, **p < 0.005.

