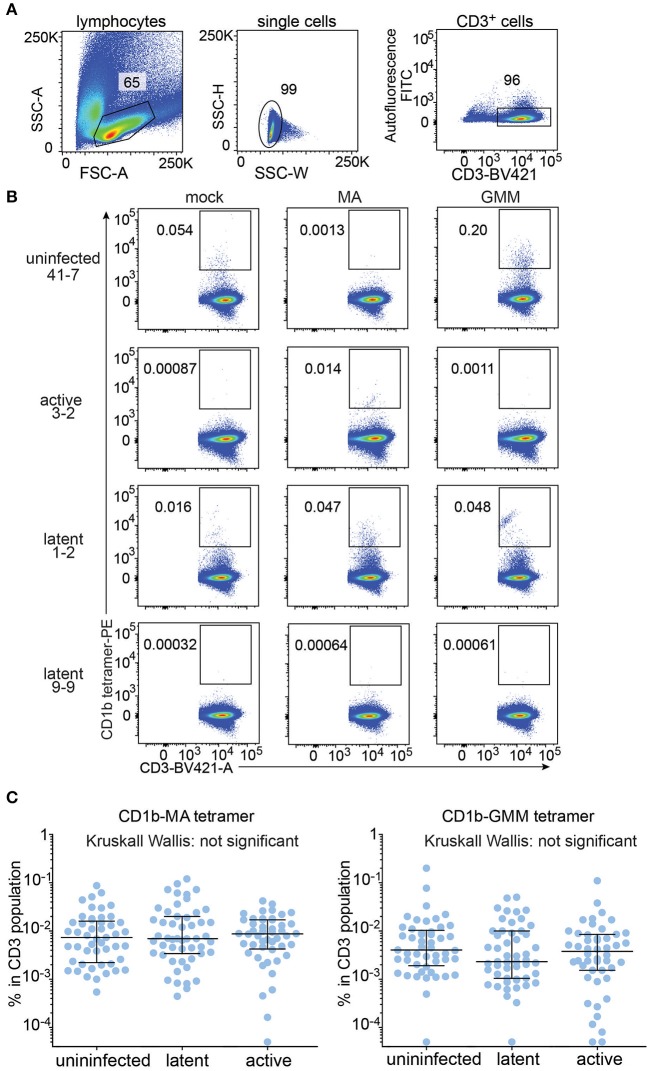
Figure 2.
Quantification of CD1b-mycolic acid and CD1b-glucose monomycolate tetramer+ T cells in a Peruvian TB cohort. (A) Expanded peripheral blood mononuclear cells were gated based on forward and side scatter, as well as CD3 expression and low autofluorescence, which was determined in the FITC channel. (B) Representative flow cytometry plots of four of the 150 members of the cohort after staining with CD1b-mock, CD1b-MA, and CD1b-GMM tetramers after pre-gating as shown in (A). Numbers indicate percent cells in gate. (C) Frequencies of tetramer+ T cells among all subjects of the Peruvian cohort, analyzed by TB disease status. Medians and interquartile ranges of tetramer+ T cells are depicted as a percent of total CD3+ cells.

