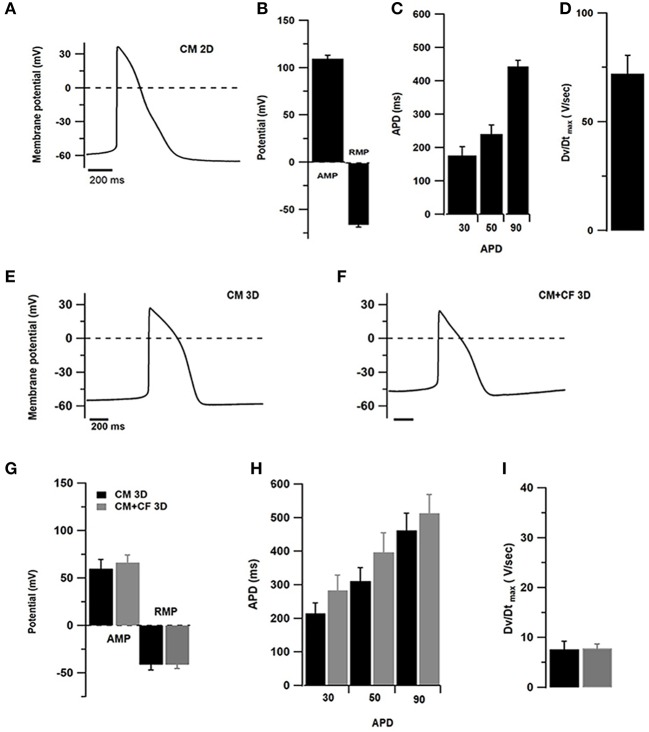
Figure 5.
Electrophysiological measurements in 2D- and 3D-cultured hiPSC-CMs (CM) with and without CF showing spontaneous APs. (A–D) Patch-clamp assessments of hiPSC-CMs cultured in 2D culture for 1 week (n = 10 cells). (A) Representative AP tracings of 2D-cultured cardiomyocytes. (B) Amplitude (AMP) and resting membrane potential (RMP). (C) Action potential duration at 20, 50, and 90% of the amplitude. (D) Maximum upstroke velocity. (E) Representative AP tracing measured in pure hiPSC-CM spheroids. (F) Representative AP tracing from co-cultured spheroids of hiPSC-CM and CF. (G) Amplitude and resting membrane potential in spheroids without (black) and with CF (gray). (H) Action potential duration at 20, 50, and 90% of the amplitude in spheroids without and with CF. (I) Maximum upstroke velocity in spheroids without and with CF. N = 6–10 spheroids per group.

