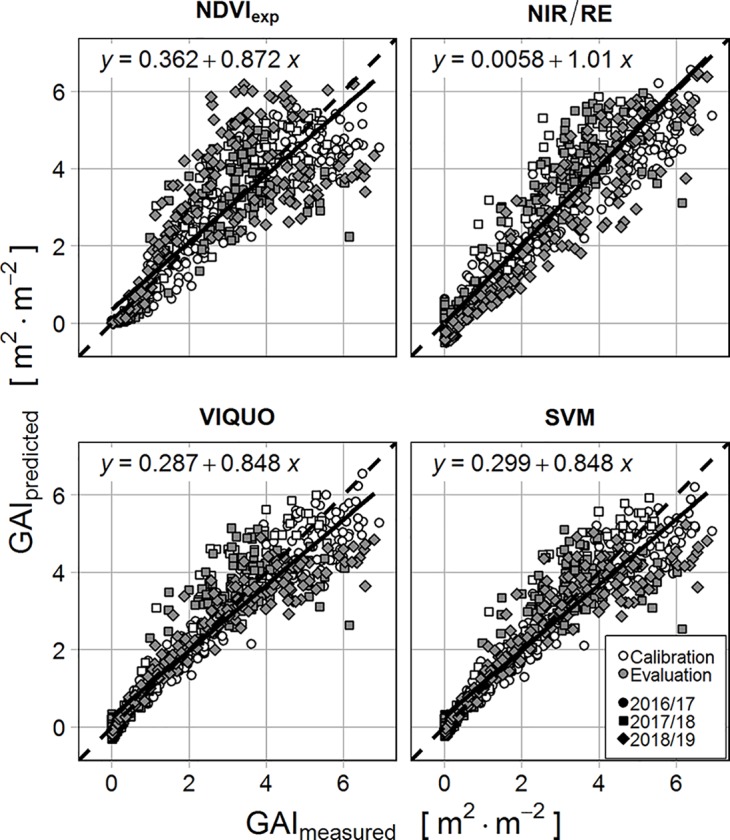
Figure 2.

Correlation of measured and predicted GAI for calibration (white) and evaluation dataset (grey) for the different VIs and equation of the linear regression of measured vs. predicted values of the evaluation dataset (different shapes illustrate the three sampling seasons).
