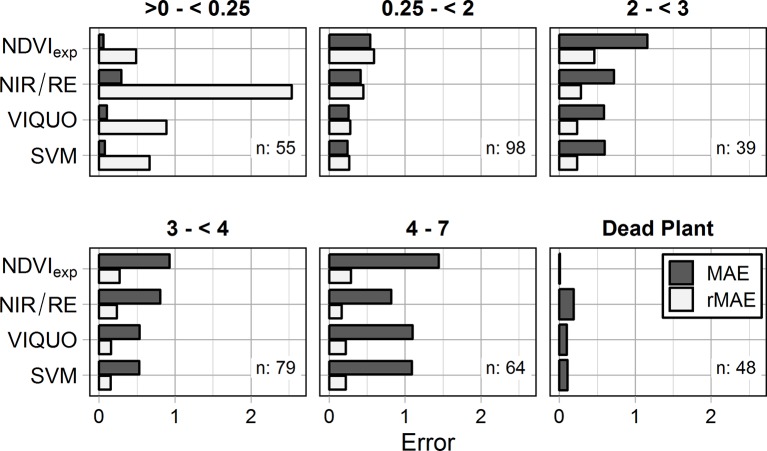
Figure 3.
Mean absolute errors (MAE [m2 m-2]) and relative Mean absolute errors (rMAE [-]) of the different VIs for the evaluation dataset, calculated individually for the different GAI-classes (n: sample size of the considered GAI-class). rMAEs of the class dead plant cannot be calculated due to division by zero.

