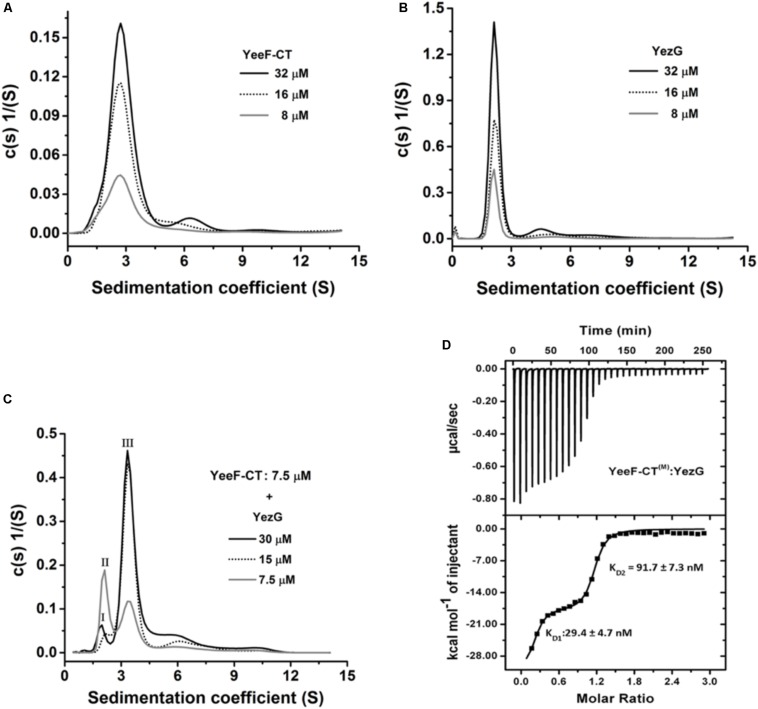
FIGURE 4.
Oligomeric state and binding kinetics of YeeF-CT, YezG, and their interactions. Sedimentation coefficient distribution (s) of YeeF-CT, YezG, and YeeF- CT/YezG are shown in panels A–C, respectively. (A,B) YeeF-CT and YezG exist predominantly as a homodimer and monomer in solution, respectively. (C) YeeF-CT/YezG associate to form a heterotetramer in solution. Peak I and II correspond to excess YezG and YeeF-CT, respectively. Peak III corresponds to YeeF-CT/YezG complex. In all the protein samples, a minor concentration-dependent higher order oligomer population is also observed. (D) A representative isotherm profile of YeeF-CT and YezG interactions. The upper panel represents the calorimetric titration and the lower panel represents derived binding isotherm plotted versus the molar ratio of the YezG.

