Figure 2.
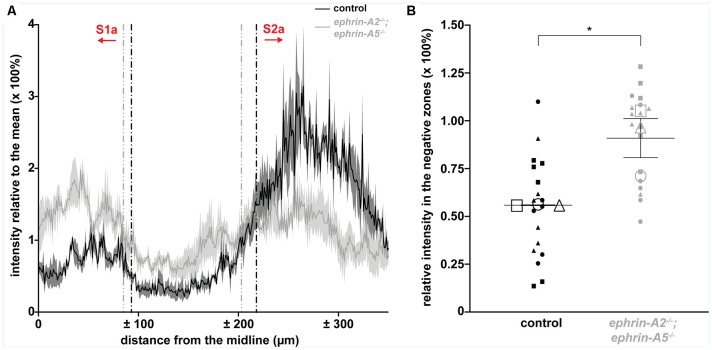
ephrin-A2−/−;ephrin-A5−/− mice have ectopic spinocerebellar terminals. (A) Plot of the WGA-Alexa 555 relative intensity in the granular layer of lobule III for control and ephrin-A2−/−;ephrin-A5−/− mice [n = 3 sections (six left/right negative zones) per animal, N = 3 animals per genotype]. The y-axis values indicate a ratio of the intensity to the mean intensity for the section, which directly represents a percentage of the mean intensity value. The x-axis values indicate the distance from the cerebellar midline as measured per pixel and scaled for μm per pixel. Vertical dotted lines indicate the boundaries of the negative zones between S1a and S2a calculated as where the second derivative of the smoothed intensity vector changes sign. The calculated zone boundaries are plotted on the original unsmoothed intensity data. Error bands indicate the standard error of the mean. (B) The WGA-Alexa 555 relative intensity in the negative zones between S1a and S2a is increased in the ephrin-A2−/−;ephrin-A5−/− mice [control = 56.1% ± 0.21%; ephrin-A2−/−;ephrin-A5−/− = 91.2% ± 10.3%; n = 6 negative zones per animal (small data points), N = 3 animals per genotype (large data points, each shape represents a different animal), p = 0.0267]. Error bars indicate the standard error of the mean. *p < 0.05.

