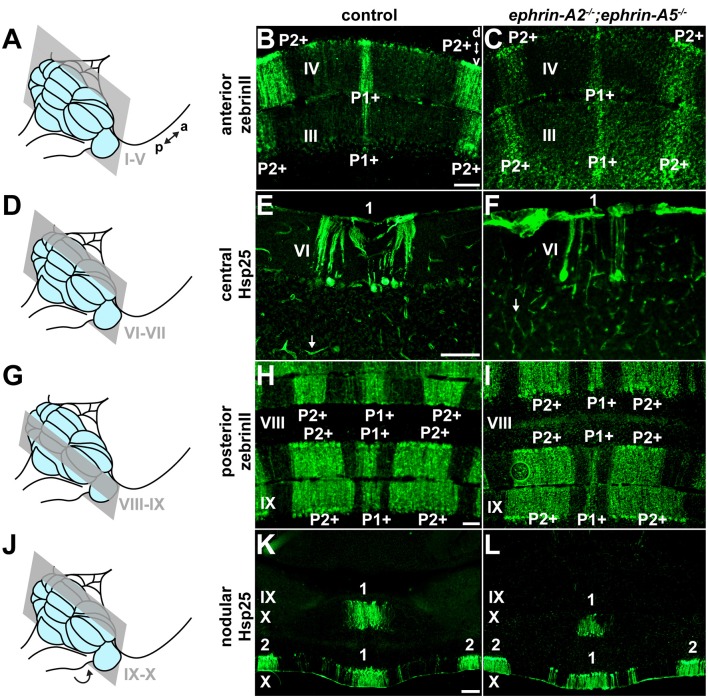
Figure 3.
ephrin-A2 and ephrin-A5 are not required for the formation of Purkinje cell zones. (A) Schematic depicting a mouse brain with the cerebellum highlighted in blue and a coronal section through the anterior cerebellum (lobules I-V) highlighted in gray. a, anterior; p, posterior. (B) Image of zebrinII expression in the anterior cerebellum of a control mouse (N = 6). A medial zone of Purkinje cells (P1+) and a zone lateral to the midline (P2+) are visible. d, dorsal; v, ventral. Scale = 100 μm. (C) Image of zebrinII expression in the anterior cerebellum of an ephrin-A2−/−;ephrin-A5−/− double knockout mouse (N = 6). The medial zone of Purkinje cells (P1+) and the zone lateral to the midline (P2+) are visible and correctly organized. (D) Schematic depicting a mouse brain with the cerebellum highlighted in blue and a coronal section through the central cerebellum (lobules VI-VII) highlighted in gray. (E) Image of Hsp25 expression in the central cerebellum of a control mouse (N = 6). The focus is on the medial zone of Purkinje cells (1). Blood vessels are also immunoreactive for Hsp25 (white arrow). Scale = 100 μm. (F) Image of Hsp25 expression in the central cerebellum of an ephrin-A2−/−;ephrin-A5−/− double knockout mouse (N = 6). The medial zone of Purkinje cells (1) has sharp boundaries. Blood vessels are also immunoreactive for Hsp25 (white arrow). (G) Schematic depicting a mouse brain with the cerebellum highlighted in blue and a coronal section through the posterior cerebellum (lobules VIII and anterior IX) highlighted in gray. (H) Image of zebrinII expression in the posterior cerebellum of a control mouse (N = 6). A medial zone of Purkinje cells (P1+) and a zone lateral to the midline (P2+) are visible. Scale = 100 μm. (I) Image of zebrinII expression in the posterior cerebellum of an ephrin-A2−/−;ephrin-A5−/− double knockout mouse (N = 6). The medial zone of Purkinje cells (P1+) and the zone lateral to the midline (P2+) are correctly organized. (J) Schematic depicting a mouse brain with the cerebellum highlighted in blue and a coronal section through the nodular cerebellum (lobules posterior IX–X) highlighted in gray. The arrow indicates that lobule X is located underneath the posterior cerebellum and is therefore out of view. (K) Image of Hsp25 expression in the nodular cerebellum of a control mouse (N = 6). A medial zone of Purkinje cells (1) and a zone lateral to the midline (2) are labeled. Scale = 200 μm. (L) Image of Hsp25 expression in the nodular cerebellum of an ephrin-A2−/−;ephrin-A5−/− double knockout mouse (N = 6). The medial zone of Purkinje cells (1) and the zone lateral to the midline (2) have a normal distribution pattern.

