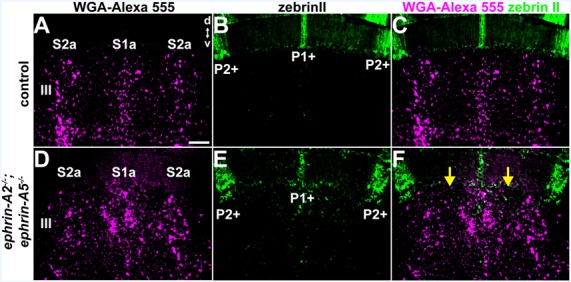
Figure 4.

The relationship between Purkinje cell zones and spinocerebellar mossy fiber zones is disrupted in ephrin-A2−/−;ephrin-A5−/− mutant mice. (A–C) Image of the WGA-Alexa 555 signal and zebrinII expression in the anterior cerebellum of a control mouse (N = 6). The patterning of the spinocerebellar mossy fiber zones has a systematic relationship to the map defined by the Purkinje cell zones. d, dorsal, v, ventral. Scale = 100 μm. (D–F) Image of the WGA-Alexa 555 signal and zebrinII expression in the anterior cerebellum of an ephrin-A2−/−;ephrin-A5−/− double knockout mouse (N = 3). The relationship between spinocerebellar terminal field zones (S1a and S2a) and the boundaries of the Purkinje cell zones (P1+ and P2+) is disrupted due to the poorly defined spinocerebellar zone boundaries (yellow arrows).
