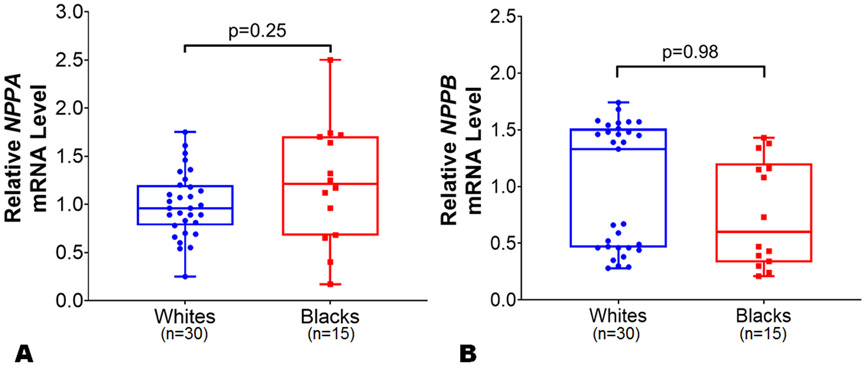
Figure 4.
Differences in NPPA and NPPB expression levels between black and white individuals in left atrial tissue. The NPPA (Panel A) and NPPB (Panel B) expression levels were normalized to the housekeeping control gene 18s. The NPPA and NPPB expression levels in blacks (n=15) were relative to white (n=30) individuals from atrial tissues from organ donor hearts with normal ventricular function in the Myocardial Applied Genomics Network (MAGNet) repository. Data are presented as mean ± SEM. 2-sample t-test with Welch correction for unequal variance was used to assess the p-value by race.

