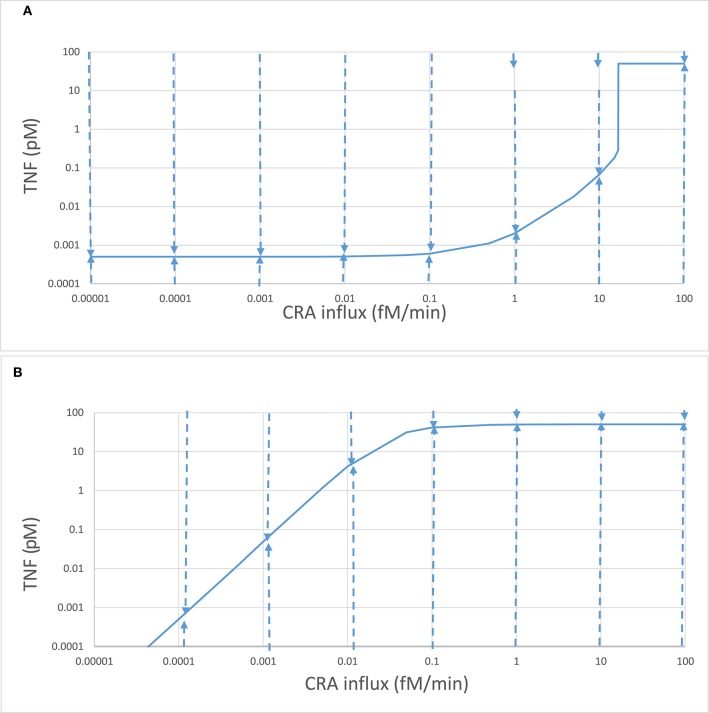
Figure 4.
Complex stability properties of the innate inflammation model. Stepwise computations again using the model of Abudukelimu et al. (42), starting from the 0.001 fM/min CRA influx steady state for the acute mode and step-wise increasing that influx or starting from the 30 fM/min CRA influx steady state for the chronic mode and stepwise decreasing that influx. In each step, the CRA influx rate was altered to the next value indicated on the abscissa, and a new steady state was calculated. (A) The steady-state TNF levels for the acute mode are plotted as ordinate. These were subsequently taken as initial conditions with the exception of the TNF level, which was equated either to 100 or to 0.0001 pM before simulating the system's evolution to steady state in time. The dashed arrow describes the evolution of the TNF level. Taking the final values as initial conditions, the steady-state mode of Copasi was used to confirm that the final condition was stable and steady, with the exception of the states at 1 and 10 fM/min where these initial conditions led to a relaxation to the upper, “chronic” state, as indicated by the small arrows at the top. In these cases, initial conditions of 10 pM rather than 100 pM TNF did lead to a relaxation to the lower, “acute” state. (B) The same as in (A) but now for the chronic branch.

