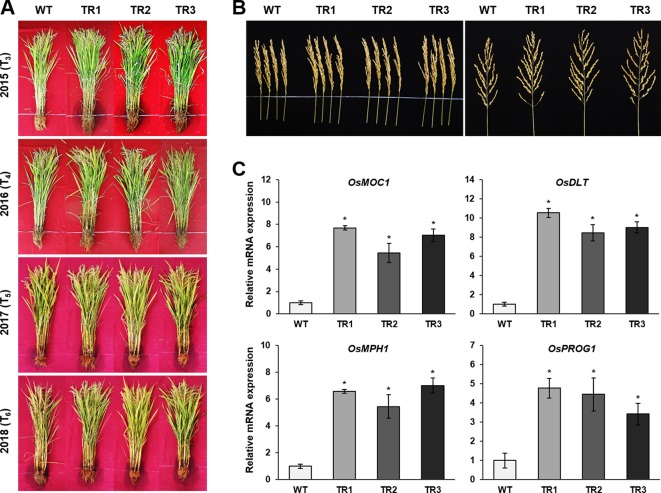
Figure 7.
Grain yields from consecutive generations of transgenic plants in paddy fields under drought conditions. (A) The phenotype of transgenic plants at the reproductive stage in 2015 (T3), 2016 (T4), 2017 (T5), and 2018 (T6). (B) Panicle phenotype of transgenic plants at the reproductive stage. (C) qRT-PCR analysis of grain yield-related genes from transgenic and WT plants grown in paddy fields for 6 weeks. Asterisks indicate significant differences between treatments determined by Student's t-test (P < 0.05).

