Figure 1.

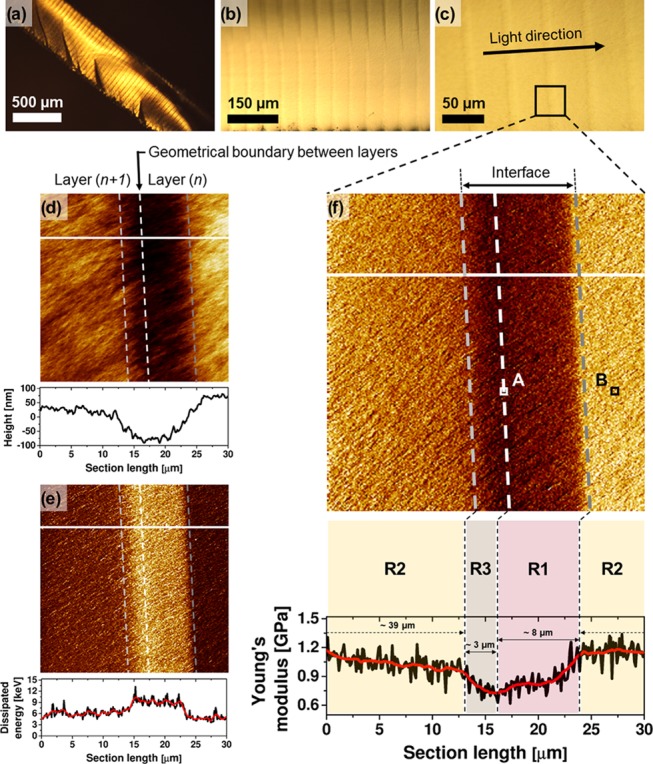
(a–c) Optical microscopy images of DLP-SLA cryo-fractured samples at different magnifications. The black square in (c) indicates the projected area in AFM analysis: quantitative AFM imaging of (d) height (color contrast encoded from 0 to 300 nm), (e) dissipated energy (color contrast encoded from 3 to 15 eV), and (f) Young’s modulus (color contrast encoded from 0.5 to 1.5 GPa) maps of the interface and its vicinity. The AFM cross sections are taken along the white lines and plotted below the maps; two profiles are smoothened (red curve) by the Savitzky–Golay method (points of window: 30, polynomial order: 2).39 The areas in AFM images are divided into three regions: R1, R2, and R3. The R1 and R3 regions form the interface. The R1/R3 borderline (white, dashed) represents a geometrical boundary at which the layer (n) starts to be cured, as the first, and the layer (n + 1) is completed and attached to the layer (n), as the next. The squares marked as A and B (in f) indicate the projected area for high-resolution quantitative AFM imaging shown in Figure 2. The indentation depth map, related to (f), is shown in the Supporting Information.
