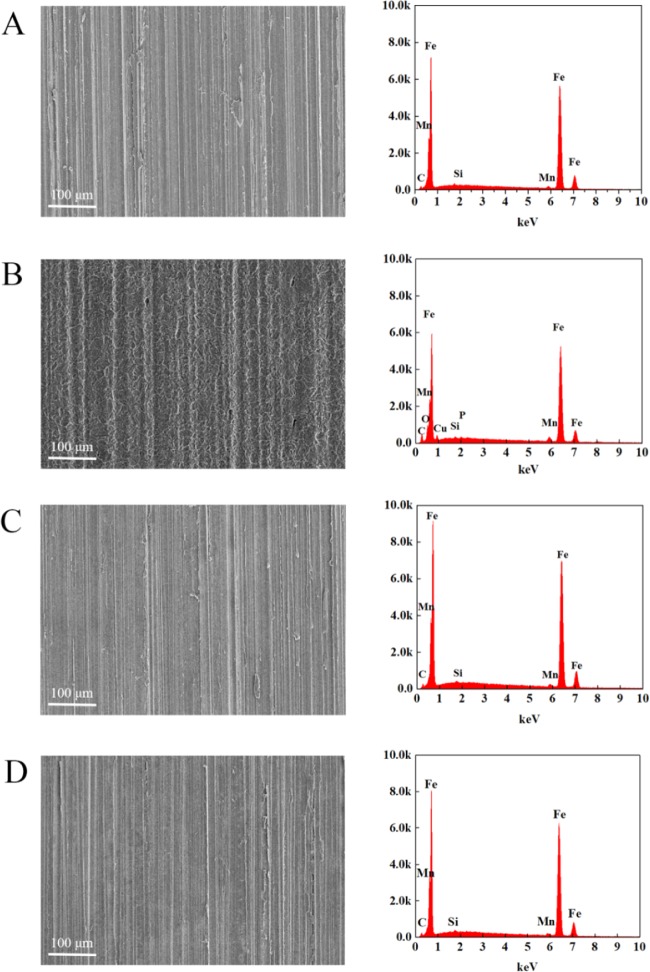
Figure 8.
SEM images (left) and the corresponding EDS images (right) obtained from the carbon steel surface after 24 h immersion in 1.0 mol·L–1 HCl acid solution: (A) prior to immersion, (B) in the absence of inhibitor, (C) in the presence of 3.0 × 10⁻⁵ mol·L–1 PDDB, and (D) in the presence of 3.0 × 10⁻⁵ mol·L–1 PDHDB.

