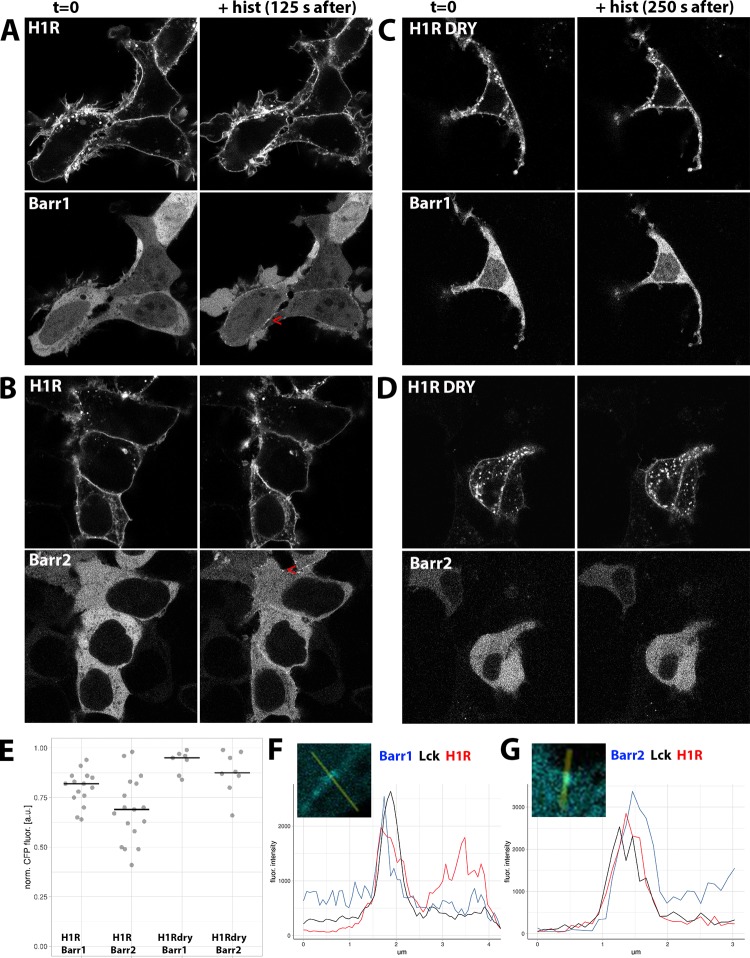
Figure 2.
ß-arrestin recruitment upon activation of WT and DRY mutants of H1R in HEK293TN cells. (A–D) Confocal images depicting the subcellular localization of WT H1R-mCh (A, B, upper panels) or H1R DRY-mCh (C, D, upper panels) coexpressed together with ßarr1-mTQ2 (A, C, lower panels) or ßarr2-mTQ2 (B, D, lower panels) in HEK293TN cells. Subcellular localization before (left) and after (right; 125 s after for the WT and at 250 s after for the DRY mutant) stimulation with 100 μM histamine. Arrowheads point to the histamine-induced localization of ß-arrestin at or near the plasma membrane. The size of the images is 60 μm × 60 μm. (E) Dotplot showing histamine-induced relocation of ß-arrestin to the plasma membrane. WT H1R-mCh or H1R DRY-mCh was coexpressed together with ßarr1-mTQ2 or ßarr2-mTQ2 in HEK293TN cells. The cytosolic fraction of ß-arrestin was measured at 250 s after stimulation with 100 μM histamine and normalized to the total ß-arrestin content prior to stimulation; centerlines show the median. (F) Line plot showing colocalization of ß-arrestin1 and H1R at the plasma membrane. Fluorescence intensity of ß-arrestin1 (blue trace), Lck (black trace), and H1R (red trace) along the line shown in the insets. The line was drawn through the ß-arrestin puncta indicated with the arrowhead in panel (A). (G) Line plot showing colocalization of ß-arrestin2 and H1R at the plasma membrane. Fluorescence intensity of ß-arrestin2 (blue trace), Lck (black trace), and H1R (red trace) along the line shown in the insets. The line was drawn through the ß-arrestin puncta indicated with the arrowhead in panel (B).

