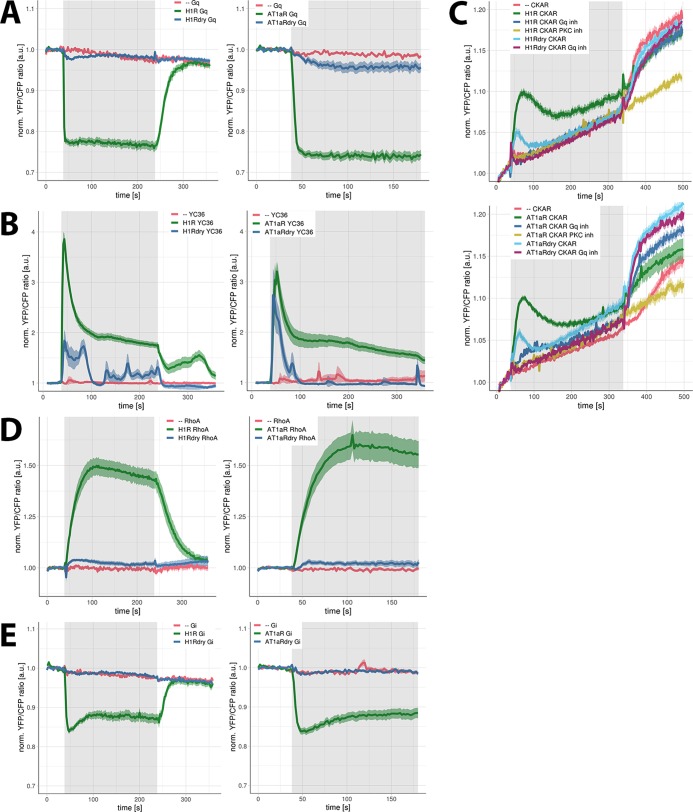
Figure 4.
Signaling activity of WT and DRY mutants of H1R and AT1AR in HEK293TN cells. (A) Gq activation by H1R, H1R DRY, AT1AR, and AT1AR DRY receptors. Time traces show the average ratio change of yellow fluorescent protein (YFP)/cyan fluorescent protein (CFP) fluorescence (and 95% confidence interval as a ribbon) in cells expressing the Gq sensor alone [N = 20 for histamine, N = 31 for AngII] or coexpressing the sensor together with H1R-p2A-mCh [N = 43], H1R DRY-p2A-mCh [N = 66], AT1AR-p2A-mCh [N = 27], or AT1AR DRY-p2A-mCh [N = 51]. Left: 100 μM histamine was added at 38 s and 10 μM pyrilamine (PY) at 238 s; right: 1 μM AngII was added at 38 s. Gray boxes mark the duration of, respectively, histamine or AngII stimulation. (B) Ca2+ changes downstream of H1R, H1R DRY, AT1AR, and AT1AR DRY receptors. Time traces show the average ratio change of YFP/CFP fluorescence (and 95% confidence interval as a ribbon) in cells expressing the YC3.6 sensor alone [N = 57 for histamine, N = 24 for AngII] or coexpressing the sensor together with H1R-p2A-mCh [N = 45], H1R DRY-p2A-mCh [N = 20], AT1AR-p2A-mCh [N = 31], or AT1AR DRY-p2A-mCh [N = 39]. Left: 100 μM histamine was added at 38 s and 10 μM PY at 238 s; right: 1 μM AngII was added at 38 s. Gray boxes mark the duration of, respectively, histamine or AngII stimulation. (C) Protein kinase C (PKC) activation downstream of H1R, H1R DRY, AT1AR, and AT1AR DRY receptors. Time traces show the average ratio change of YFP/CFP fluorescence (and 95% confidence interval as a ribbon) in cells expressing the CKAR sensor alone [N = 26 for histamine, N = 39 for AngII] or coexpressing the sensor together with H1R-p2A-mCh [N = 63], H1R DRY-p2A-mCh [N = 44], AT1AR-p2A-mCh [N = 27], or AT1AR DRY-p2A-mCh [N = 50] and untreated or treated with FR900359 [N = 34 for H1R, N = 32 for H1R DRY, N = 20 for AT1AR, N = 27 for AT1AR DRY]. Histamine (100 μM) (upper panel) or 1 μM AngII (lower panel) was added at 38 s, and 100 nM phorbol myristate acetate (PMA) (a potent PKC activator) was added at 338 s. Gray boxes mark the duration of, respectively, histamine or AngII stimulation. The observed PKC activation was abolished with a specific PKC inhibitor (10 μM Ro31-8425; N = 15 for histamine, N = 20 for AngII). Note: the continuous increase of YFP/CFP fluorescence observed in all time traces results from donor photobleaching. (D) RhoA activation downstream of H1R, H1R DRY, AT1AR, and AT1AR DRY receptors. Time traces show the average ratio change of YFP/CFP fluorescence (± and 95% confidence interval as a ribbon) in cells expressing the DORA-RhoA sensor alone [N = 17 for histamine, N = 16 for AngII] or coexpressing the sensor together with H1R-p2A-mCh [N = 36], H1R DRY-p2A-mCh [N = 16], AT1AR-p2A-mCh [N = 26], or AT1AR-p2A-mCh [N = 27]. Left: 100 μM histamine was added at 38 s and 10 μM PY at 238 s; right: 1 μM AngII was added at 38 s. Gray boxes mark the duration of, respectively, histamine or AngII stimulation. (E) Gi1 activation by H1R, H1R DRY, AT1AR, and AT1AR DRY receptors. Time traces show the average ratio change of YFP/CFP fluorescence (and 95% confidence interval as a ribbon) in cells expressing the Gi sensor alone [N = 14 for histamine, N = 19 for AngII] or coexpressing the sensor together with H1R-p2A-mCh [N = 43], H1R DRY-p2A-mCh [N = 39], AT1AR-p2A-mCh [N = 15], or AT1AR DRY-p2A-mCh [N = 44]. Left: 100 μM histamine was added at 38 s and 10 μM PY at 238 s; right: 1 μM AngII was added at 38 s. Gray boxes mark the duration of, respectively, histamine or AngII stimulation.

