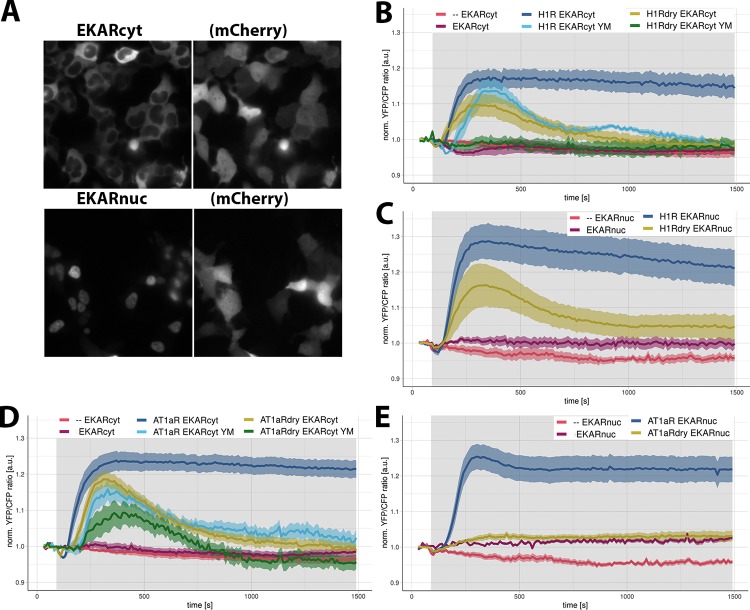
Figure 5.
ERK1/2 activation downstream of WT and DRY mutants of H1R and AT1AR in HEK293TN cells. (A) Wide-field images of the subcellular localization of EKARcyt and EKARnuc reporters in HEK293TN cells. Localization of the coexpressed free mCherry (mCh) shows the labeling of the complete cell. The size of the images is 105 μm × 105 μm. (B, C) ERK1/2 activation downstream of WT and DRY mutants of H1R. Time traces show the average ratio change of YFP/CFP fluorescence (and 95% confidence interval as a ribbon) in cells expressing the EKARcyt [N = 26] or EKARnuc [N = 20] sensor; coexpressing H1R-p2A-mCh and EKARcyt or EKARnuc and untreated [N = 49 for EKARcyt, N = 25 for EKARnuc] or treated with YM254890 [N = 7]; coexpressing H1R DRY-p2A-mCh and EKARcyt or EKARnuc and untreated [N = 16 for EKARcyt, N = 22 for EKARnuc] or treated with YM254890 [N = 11]. Histamine (100 μM) or vehicle (--) [N = 39 for EKARcyt, N = 5 for EKARnuc] was added at 90 s; gray boxes mark the duration of histamine stimulation. (D, E) ERK1/2 activation downstream of WT and DRY mutants of AT1AR. Time traces show the average ratio change of YFP/CFP fluorescence (and 95% confidence interval as a ribbon) in cells expressing EKARcyt [N = 41] or EKARnuc [N = 17] sensor; coexpressing AT1AR-p2A-mCh and EKARcyt or EKARnuc and untreated [N = 70 for EKARcyt, N = 65 for EKARnuc] or treated with YM254890 [N = 14]; coexpressing AT1AR DRY-p2A-mCh and EKARcyt or EKARnuc and untreated [N = 22 for EKARcyt, N = 26 for EKARnuc] or treated with YM254890 [N = 10]. AngII (1 μM) or vehicle (--) [N = 39 for EKARcyt, N = 5 for EKARnuc] was added at 90 s; gray boxes mark the duration of AngII stimulation.

