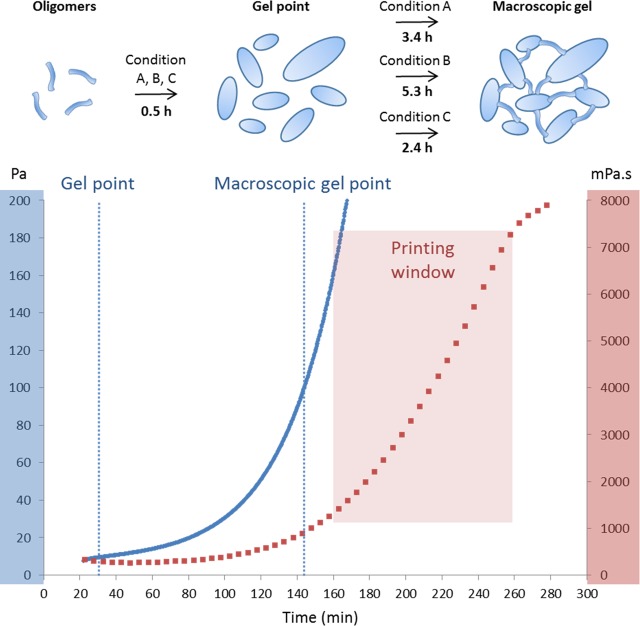
Figure 3.
Schematic representation of the catalysis process and gelation times as a function of catalyst condition (up) and HPMC-Si 2 hydrogel (13.5 wt %) gelation in condition C, recorded as a function of time (down). Viscosity, red trace; storage modulus (G′), blue trace. The printing window is experimentally set between 160 and 260 min.

