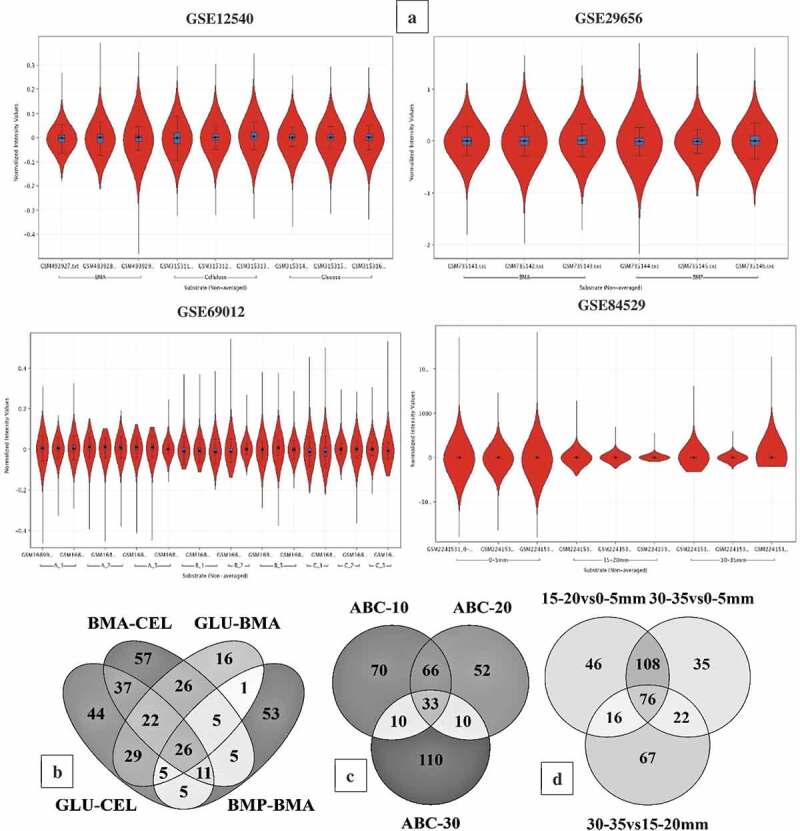
Figure 3.

(a) Violin plots showing the distribution of differentially expressed significant genes in GSE12540, GSE29656, GSE69012, and GSE84529 datasets. Venn diagrams showing the number of commonly expressed genes among the R. placenta datasets (b) Venn diagram of differentially expressed significant genes among the GSE12540-GSE29656 datasets experimental conditions where BMA- Ball milled aspen, BMP-Ball milled pine, GLU- glucose, CEL-Cellulose. (c) Venn diagram of differentially expressed significant genes among the experimental conditions of GSE69012 dataset where A- high lignin: low glucose, B- low lignin: high glucose, C- average lignin: average glucose, ABC-10, ABC-20 and ABC-30 refers to genes common among A,B and C datasets cultured at 10, 20 and 30 days of incubation periods, (d) Venn diagram of differentially expressed significant genes among the experimental conditions of GSE84529 dataset where 0-5mm vs 15-20mm, here we have compared the differentially expressed gene list obtained from 0-5mm vs 15-20mm growth conditions similar for other compared conditions 30-35mm vs 0-5mm and 30-35mm vs 15-20mm respectively.
