Figure 5.

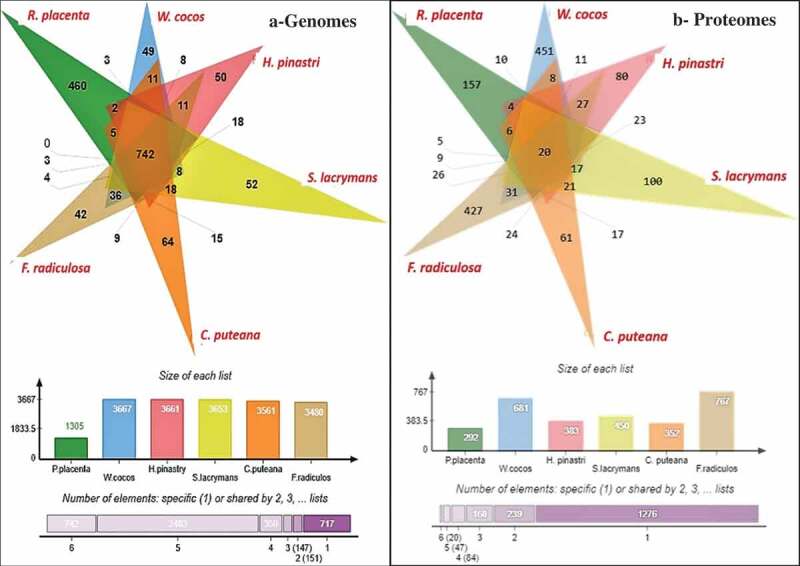
Six-way Venn diagrams showing the number of commonly expressed genes among the (a) genome wide proteomic annotations and (b) differentially expressed significant genes from the gene expression datasets.

Six-way Venn diagrams showing the number of commonly expressed genes among the (a) genome wide proteomic annotations and (b) differentially expressed significant genes from the gene expression datasets.