
Figure 2.
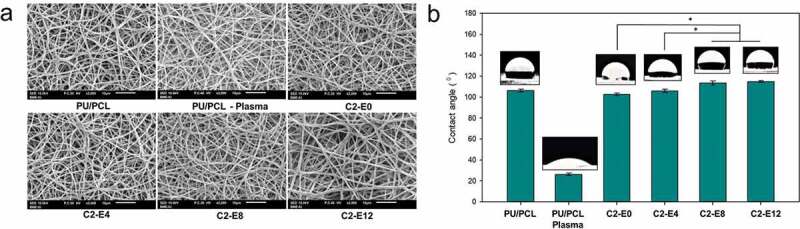
(a) SEM images of the membranes. (b) Contact angle of the water droplet on the surface of the membranes. The images illustrate the contact angle closest to the mean value of its sample. *: p < 0.05
Official websites use .gov
A
.gov website belongs to an official
government organization in the United States.
Secure .gov websites use HTTPS
A lock (
) or https:// means you've safely
connected to the .gov website. Share sensitive
information only on official, secure websites.
(a) SEM images of the membranes. (b) Contact angle of the water droplet on the surface of the membranes. The images illustrate the contact angle closest to the mean value of its sample. *: p < 0.05