Fig. 1.
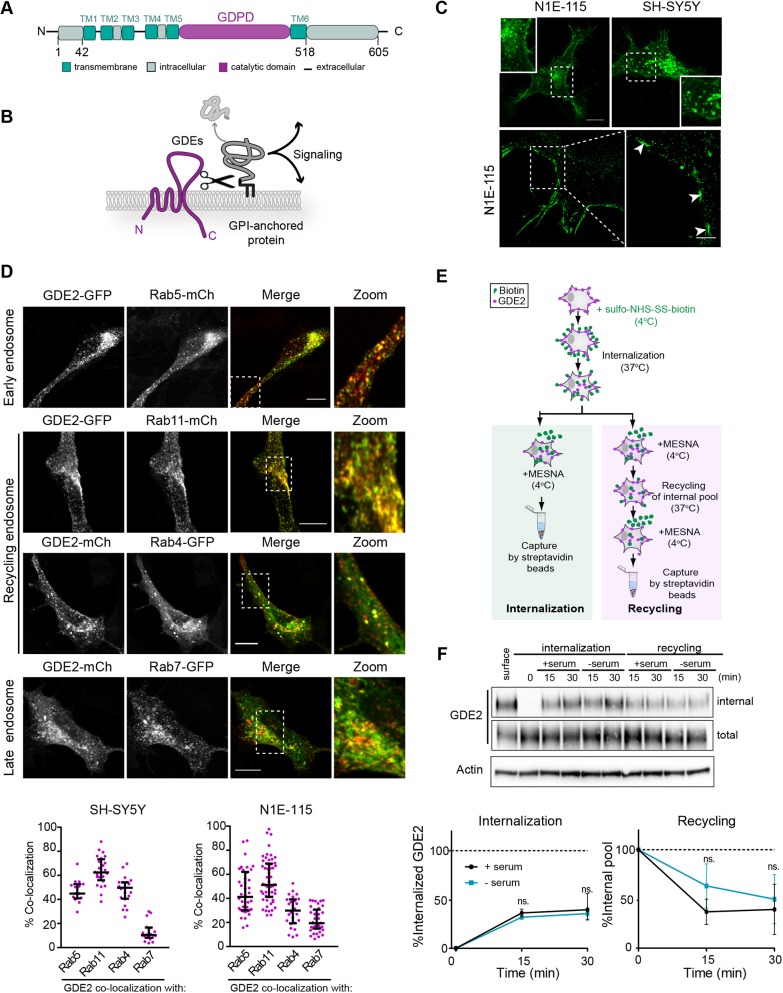
GDE2 localization and endocytic trafficking routes. (A) Domain structure of GDE2 showing six transmembrane (TM) domains, a GDPD ectodomain and intracellular N- and C-terminal tails. (B) GDE2 cleaves and sheds GPI-anchored proteins resulting in activation of signaling cascades. (C) GDE2 subcellular localization. Top, confocal images showing GDE2–GFP in membrane microdomains and intracellular vesicles in N1E-115 and SH-SY5Y cells. Bottom, super-resolution images of N1E-115 cells expressing GDE2–GFP. White arrows point to membrane microdomains. Scale bars: 10 μm (top), 1 μm (bottom). See also Matas-Rico et al. (2016). (D) Confocal images of GDE2 in early, recycling and late endosomes (Rab5-, Rab11-, Rab4- and Rab7-positive, respectively), in SH-SY5Y cells. Scale bars: 10 μm. Bottom panels show quantification of GDE2 colocalization with the indicated Rab GTPases, expressed as the percentage of yellow versus red pixels (≥25 cells from three independent experiments). Data represent the median±interquartile range of colocalization. (E) Schematic illustration of the internalization and recycling assay using biotin labeling. Cells expressing GDE2–mCh were surface-labeled with NHS-S-S-Biotin. Internalization proceeded for 15 and 30 min at 37°C in presence or absence of 10% FBS. Surface biotin was reduced with MesNa at 4°C, and the cells were shifted to 37°C for the indicated time periods to trigger recycling of the internal pool. (F) The amount of internalized and total biotin-labeled GDE2 in SH-SY5Y cells was determined by immunoblotting using anti-HA antibody. Actin was used as loading control. SH-SY5Y cells inducibly expressing GDE2–HA were surface-labeled with NHS-S-S-Biotin. Labeled GDE2 was allowed to internalize or recycle in the presence or absence of 10% FBS, as indicated. Representative western blots are shown as well as quantified band density from three independent experiments. Internalization was normalized to surface GDE2, and recycling to the internalized pool after 30 min. Data represent the mean±s.e.m. Results were not significantly different (ns) between with or without serum (one-way ANOVA). Similar results were obtained in N1E-115 cells (Fig. S2C).

