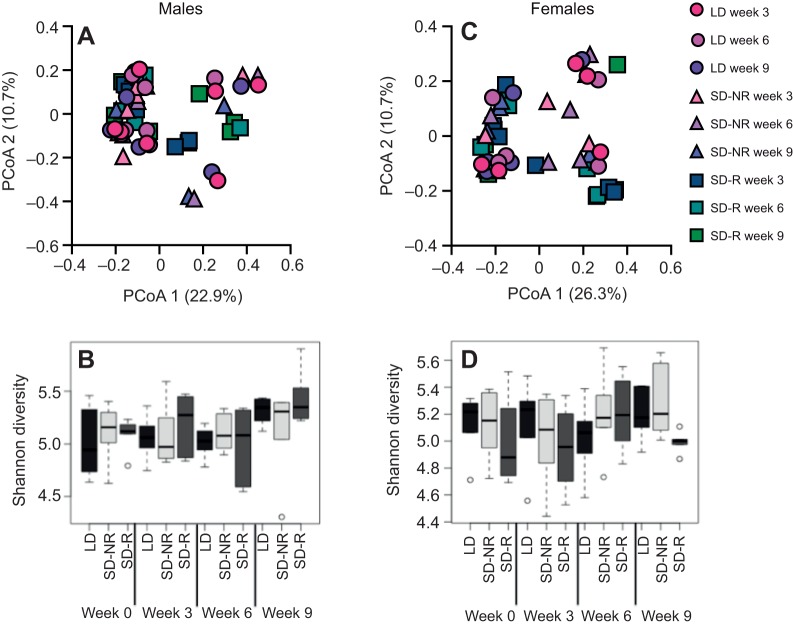
Fig. 3.
Overview of gut microbial communities in male and female hamsters. (A,C) Principal coordinates analyses (PCoAs) of the microbiome in male (A) and female (C) hamsters (LD: N=6, SD-R: N=6, SD-NR: N=6, for both males and females). Data are shown for LD hamsters (circles), SD-NR hamsters (triangles) and SD-R hamsters (squares) following 3, 6 and 9 weeks of treatment (see key). (B,D) Box and whisker plots of Shannon–Wiener diversity across photoperiodic treatment groups (LD, SD-NR and SD-R) and time (weeks 3, 6 and 9) in male (B) and female (D) hamsters. Lines represent the median; boxes represent quartiles; whiskers represent the minimum and maximum Shannon–Wiener diversity values. Outliers are represented as single open circles.

