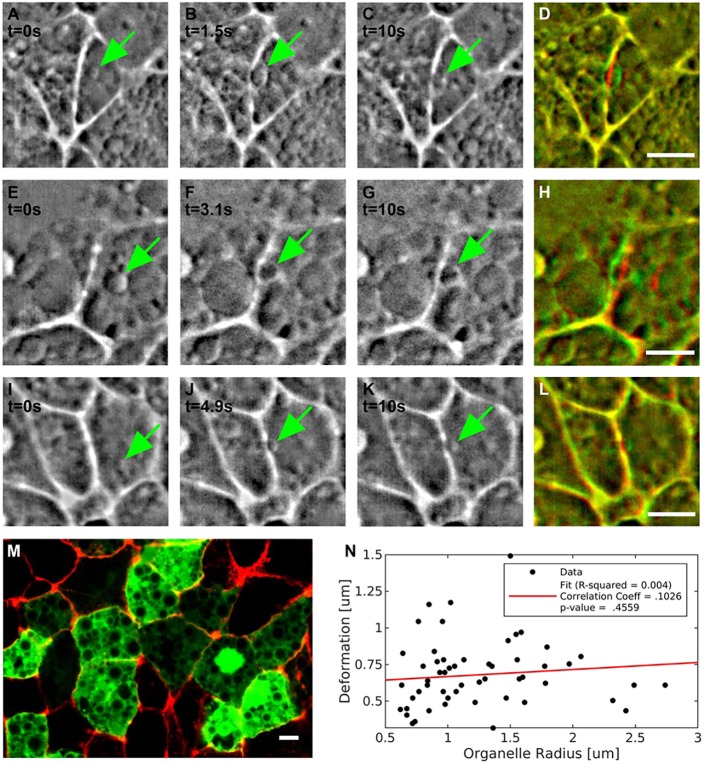
Fig. 2.
Role of trapped organelles in the deformation of the junctions. (A-L) Representative images of three pull-and-release experiments. In each experiment, an organelle (green arrow) is trapped and drives the deformation of the junction. (A-D) The sequence shown is extracted from Movie 2. In the three sequences (A-D, E-H and I-L), the first image in each row (A,E,I) shows the vesicle before being trapped; B,F,J show the vesicle after being pushed against the membrane; C,G,K show the vesicle at the end of the experiment when the trap is off. (D,H,L). The three sequences represent the different scenarios we observed during the experiments. In A-D, an organelle locally deforms the junction; in E-H, the deformation caused by the organelle extends across the whole junction; in I-L, the junction does not deform despite an organelle pushing against it. (M) Image of a confocal section of the area opaca epiblast of a HH1 stage embryo in which some random transfected cells express a cytosolic GFP (green) highlighting the abundance of organelles, which are visible as dark structures of different sizes in the cytosol of typical epiblast cells. The cell boundaries are visualized by actin staining (red). The cells have been transfected with a cytoplasmatic GFP; construct shows vesicles as dark spots. (N) Absence of correlation between sizes of trapped organelles and deflections of the junctions. The dataset has a correlation coefficient (r) of 0.103 and P=0.46, thus confirming that the measured deformations are not dependent on the sizes of trapped organelles. Scale bars: 5 µm.

