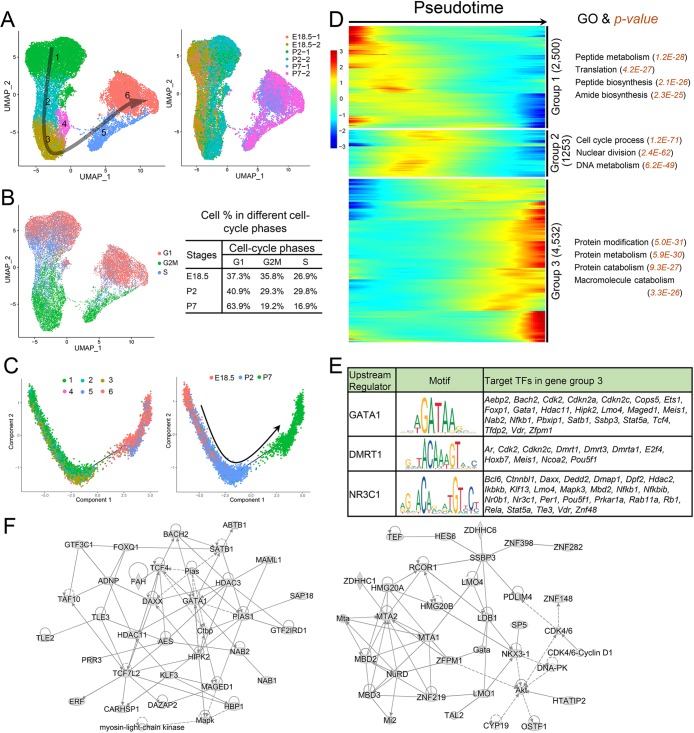
Fig. 4.
Identification of SC clusters during the perinatal period. (A) UMAP plot of SCs from E18.5, P2 and P7 mouse testes. Left: SC clusters; right: sample source. Arrow indicates the inferred developmental direction from the analysis shown in C. Number of cells in each cluster: 1 (8693), 2 (2358), 3 (3273), 4 (566), 5 (1647) and 6 (5242). (B) Left: UMAP plot inferring the cell-cycle phase based on expression of a large set of G2/M- and S-phase genes (Kowalczyk et al., 2015). Right: percentages of SCs in different cell-cycle phases from different stages. (C) Monocle pseudotime trajectory analysis of the SC clusters. Left: SC clusters; right: segregated by perinatal age. (D) Heatmap of DEGs from different SC subsets following the trajectory timeline shown in C. Top: pseudotime directions; right: the number of DEGs and the representative biological processes and P-values. (E) Left: upstream regulator (TF) genes exhibiting enriched expression in group 3 (shown in D) that are predicted (by the IPA program) to target group 3 TF genes. Middle: target sequences predicted by the ENCODE database. Right: TF genes predicted to be regulated by the indicated upstream regulator. Znf48 is also known as Zfp553. (F) Gene networks inferred from transcription factors enriched in the gene cluster 3 shown in D.

