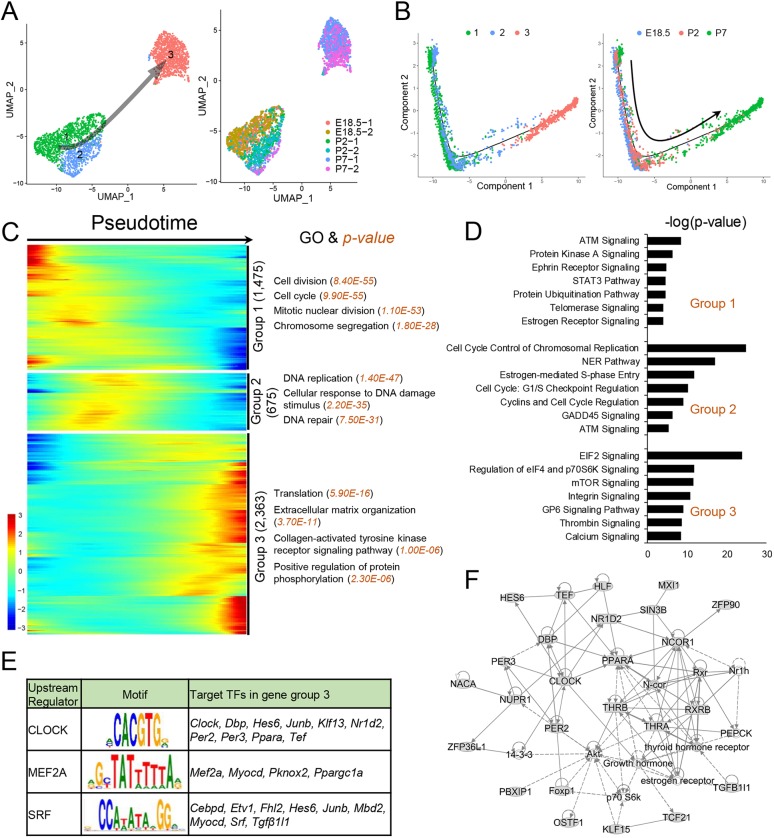
Fig. 5.
Identification of PTM clusters during the perinatal period. (A) UMAP plot of PTMs from E18.5, P2 and P7 mouse testes. Left: PTM clusters; right: developmental stage information. Arrow indicates the inferred developmental direction from the analysis shown in C. Number of cells in each cluster: 1 (1068), 2 (532) and 3 (1227). (B) Pseudotime trajectory analysis of the PTM clusters. Left: PTM clusters; right: segregated by perinatal age. (C) Heatmap of DEGs from different PTM subsets following the trajectory timeline shown in B. Top: pseudotime direction; right: the number of DEGs and the representative biological processes and P-values. (D) The top enriched signaling pathways of DEGs as defined in C. (E) Left: upstream regulator (TF) genes exhibiting enriched expression in group 3 (shown in C) that are predicted (by the IPA program) to target group 3 TF genes. Middle: target sequences predicted by the ENCODE database. Right: TF genes predicted to be regulated by the indicated upstream regulator. (F) Gene network inferred from transcription factors enriched in the gene cluster 3 shown in C.

