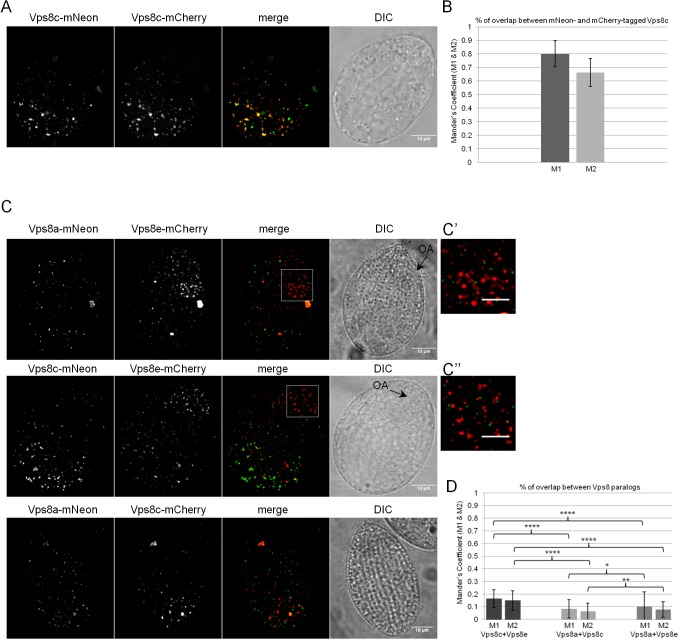
Fig. 5.
8A-CC and 8C-CC localize to non-overlapping compartments. (A) Cells expressing Vps8c–mNeon and Vps8c–mCherry at the VPS8C and VPS8A loci, respectively. Shown is a maximum-intensity projection of a confocal z-stack of a fixed cell. Paired DIC images are confocal cross sections. (B) Mean±s.d. values of the colocalization coefficients M1 and M2 for Vps8c–mNeon and Vps8c–mCherry were calculated with 261 non-overlapping images using the Fiji-JACoP plugin. The two fusion proteins largely overlap. (C) Cells co-expressing the following combinations of tagged proteins: Vps8e–mCherry with Vps8a-mNeon (top); Vps8e–mCherry with Vps8c–mNeon (middle); Vps8a–mNeon with Vps8c–mCherry (bottom). Shown are maximum intensity projections of confocal z-stacks of fixed cells. The boxed regions in top and middle panels (magnified in C′ and C″) highlight Vps8e-related vesicles close to the oral apparatus (black arrows labeled OA in the paired DIC images). (D) Mean±s.d. values of the colocalization coefficients M1 and M2 for Vps8a with Vps8e, Vps8c with Vps8e, and Vps8a with Vps8c were calculated with 246, 337 and 399 non-overlapping images/sample as in B. P-values for M1 and M2 coefficients are shown. ****P<0.0001; *P=0.0113; **P=0.0048 (two-tailed t-test). The paralogs localize to largely non-overlapping cellular structures. Scale bars: 10 μm (main images); 5 μm (C′,C″).

