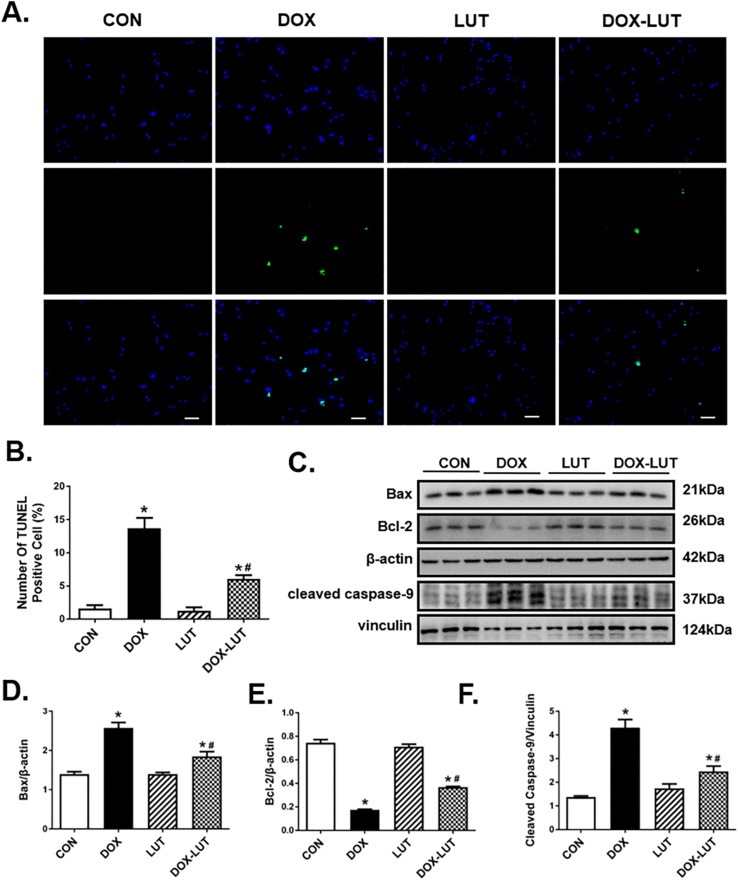
FIGURE 2.
Effect luteolin treatment on doxorubicin-induced cardiomyocyte apoptosis. (A) Representative TUNEL staining depicting AMCM apoptosis after doxorubicin and luteolin treatment. All nuclei were stained with DAPI (blue), whereas TUNEL-positive nuclei were visualized using green fluorescence. Original magnification = 200×. (B) Quantified TUNEL apoptosis manifested as percentage of TUNEL-positive cells from nine fields per group. (C) Representative western blot images of AMCM apoptosis using Bax, Bcl-2 and cleaved caspase-9. (D–F) Quantitative analysis of cardiomyocyte apoptosis using Bax, Bcl-2 and cleaved caspase-9. Scale bars = 50 μm. Mean ± SEM, n = 3 independent experiment. * p < 0.05 vs. CON group, # p < 0.05 vs. DOX group.

