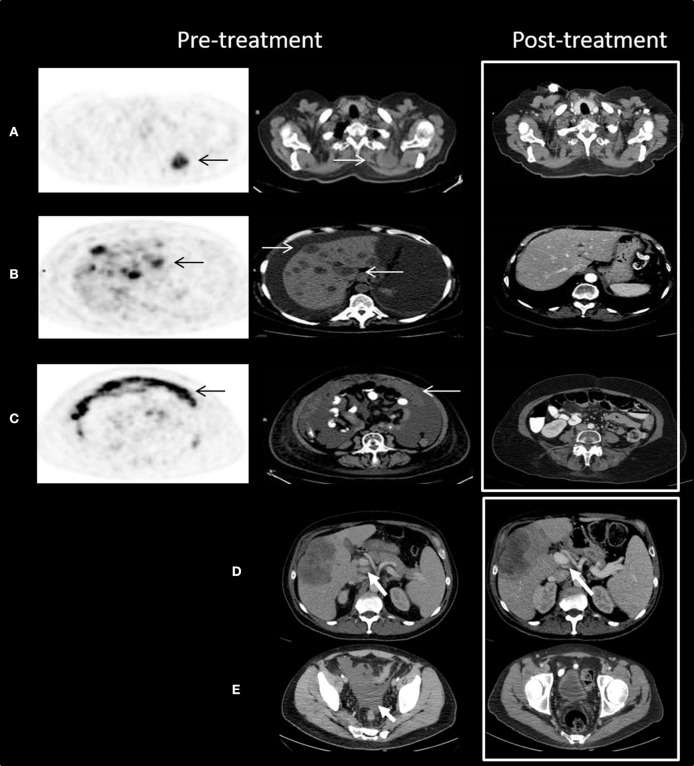
Figure 1.
Outstanding response to chemotherapy after progression on anti-PD1 treatment. (A–C) Patient R.H. Trans-axial slices of pre-treatment 18F-FDG PET/CT scan illustrate advanced metabolically highly active (black arrows) metastatic disease in the following areas: (A) the left upper chest posterior 4.0 cm mass (white arrows) with SUV max 11.3; (B) multiple liver lesions with SUV max up to 15.8; and (C) omental cake with SUV max up to 14.2. Post-treatment CT scan (white frame) demonstrates complete resolution of all pre-treatment findings. (D,E) Patient M.G. Axial slices of contrast enhanced CT scan show enlarged porta hepatis lymph nodes (D) and medium amount of ascites in the pelvis (E). Following treatment, the lymph nodes decreased in size and the ascites resolved. Decrease in size of the metastatic deposit in the right hepatic lobe can be also seen.

