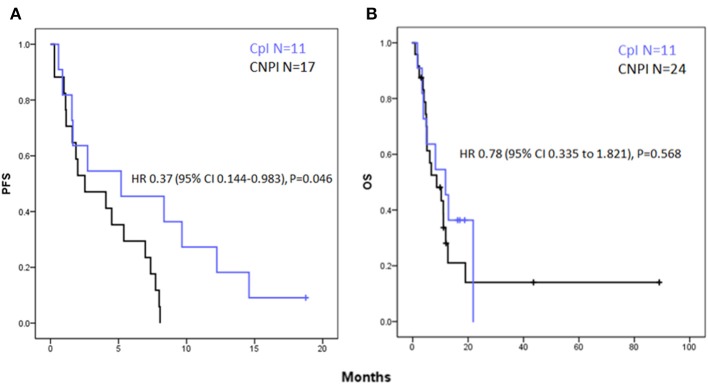
Figure 2.
Kaplan- Meier curves for (A) progression free survival showing a significant increase in PFS in the CpI group vs. CNPI with a hazard ratio (HR) of 0.37; [95% Confidence interval (CI) 0.144–0.983], P = 0.046. (B) Overall survival showing a non-significant trend toward improved OS in the CpI group HR 0.78 [95% Confidence interval (CI) 0.335–1.821], P = 0.568.

