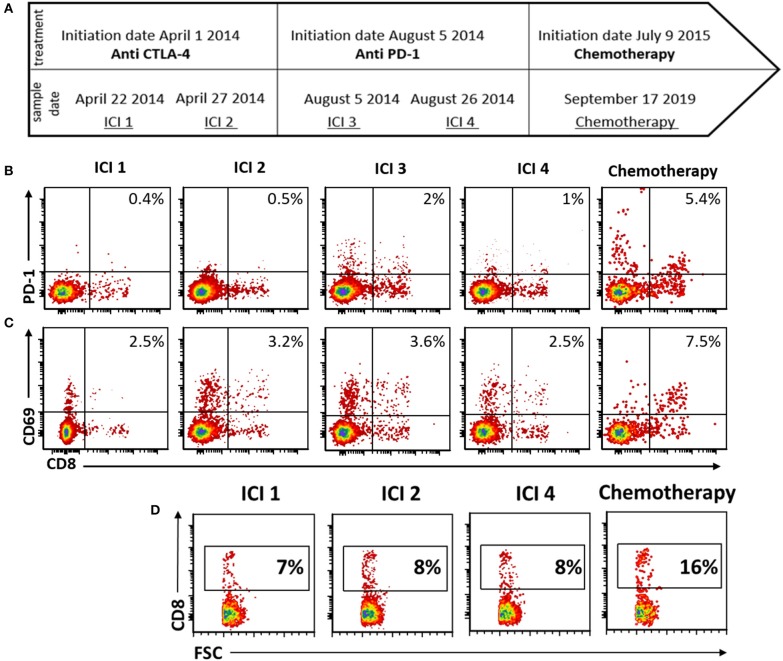
Figure 3.
Peripheral blood immune-monitoring demonstrates an increase in effector phenotype and CD8+ fraction following chemotherapy. (A) Timeline of blood collection and corresponding treatment given. (B–D) Flow cytometry of peripheral mononuclear blood cells (PBMCs) following activation with anti CD3 (B) stained for PD-1. (C) CD69 and (D) CD3.

