Figure 1.

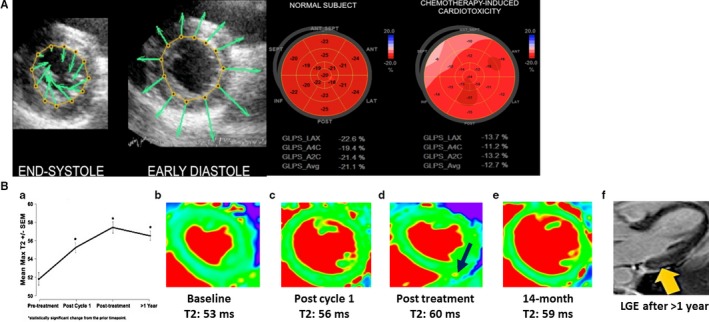
A, (Left) Velocity vector imaging tracking endomyocardial border throughout the cardiac cycle. (Right) Bull's‐eye plot of average peak systolic global longitudinal strain in a normal subject compared with that of a patient with chemotherapy‐induced cardiotoxicity. Adapted from Mele et al17 under the Creative Commons Attribution Non‐Commercial‐NoDerivs (CC‐BY‐NC‐ND) license. B, Objective increase in myocardial T2 mapping values (a marker of inflammation/edema) after cardiotoxic anthracycline therapy exposure (A through E), even before cardiac fibrosis (F; yellow arrow, LGE) and clinical heart failure (with left ventricular ejection fraction decline) development among breast cancer patients via use of T2 mapping. Note: maximum T2 plateaus and actually declines after cancer therapy cessation (A, D, and E; black arrow in D, high T2). Adapted with permission from Lustberg et al18 Copyright ©2019, Wolters Kluwer Health, Inc. LGE indicates late gadolinium enhancement.
