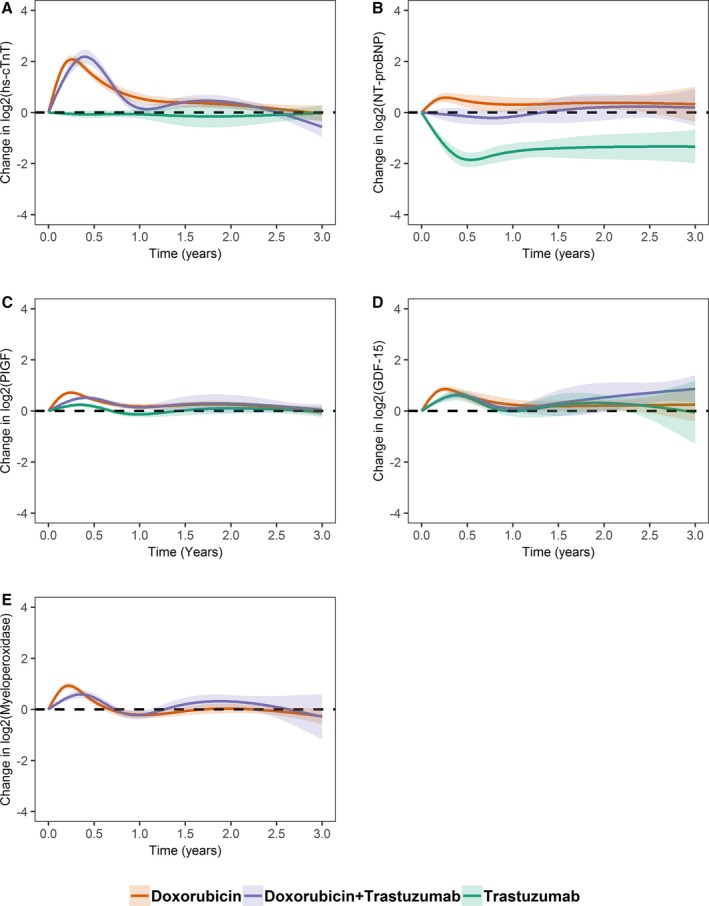
Figure 2.

Mean estimated changes in biomarkers over time according to cancer therapy regimen. The solid line represents mean estimated changes over time and the width of the surrounding band represents the corresponding 95% CI. Biomarker levels were log2 transformed (a unit increment from baseline should be interpreted as doubling); (A) high‐sensitivity cardiac troponin T (hs‐cTnT), (B) NT‐proBNP (N‐terminal pro‐B‐type natriuretic peptide), (C) placental growth factor (PIGF), (D) growth differentiation factor 15 (GDF‐15), and (E) myeloperoxidase.
