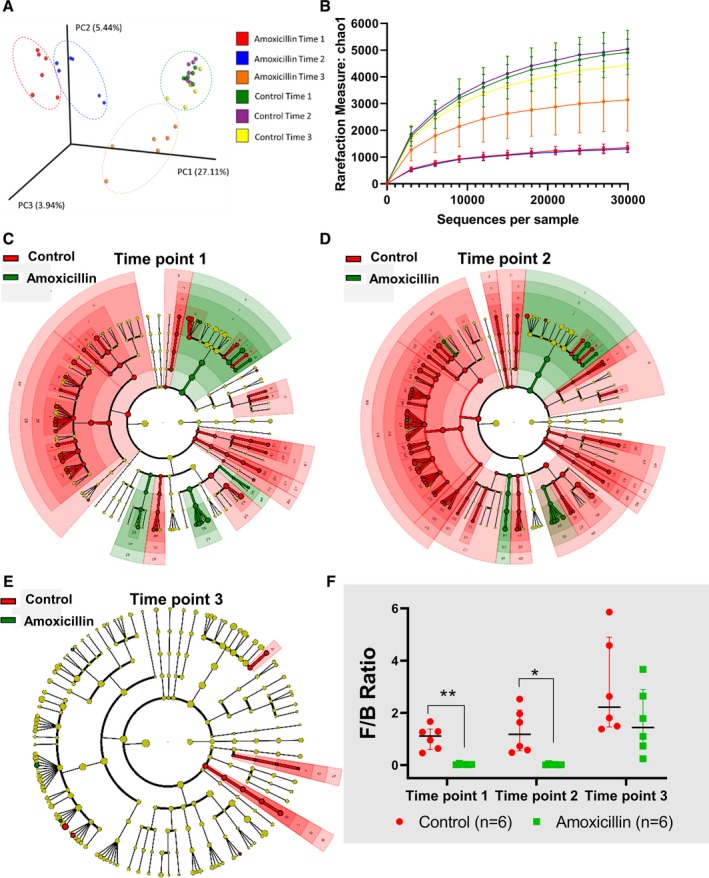
Figure 2.

Study 1: gut microbiota of young rats on amoxicillin compared with control rats. Male Dahl S rats (n=6/group) were individually housed, and fresh fecal samples were collected from 3 time points. A, Unweighted‐beta diversity of all 3 time points of amoxicillin or control rats, (B) alpha‐diversity/chao1 measurement of all 3 time points of amoxicillin or control rat, (C) cladogram of bacterial community at time point 1, (D) cladogram of bacterial community at time point 2, (E) cladogram of bacterial community at time point 3, and (F) F/B ratio of all 3 time points of amoxicillin or control rats. *P<0.05; **P<0.01. Note: Larger versions of each of the cladograms and further details on the bacterial taxa are presented in Figures S1 through S3. Data are presented as median and interquartile range. PC indicates principle component. *p<0.05, **p<0.01.
