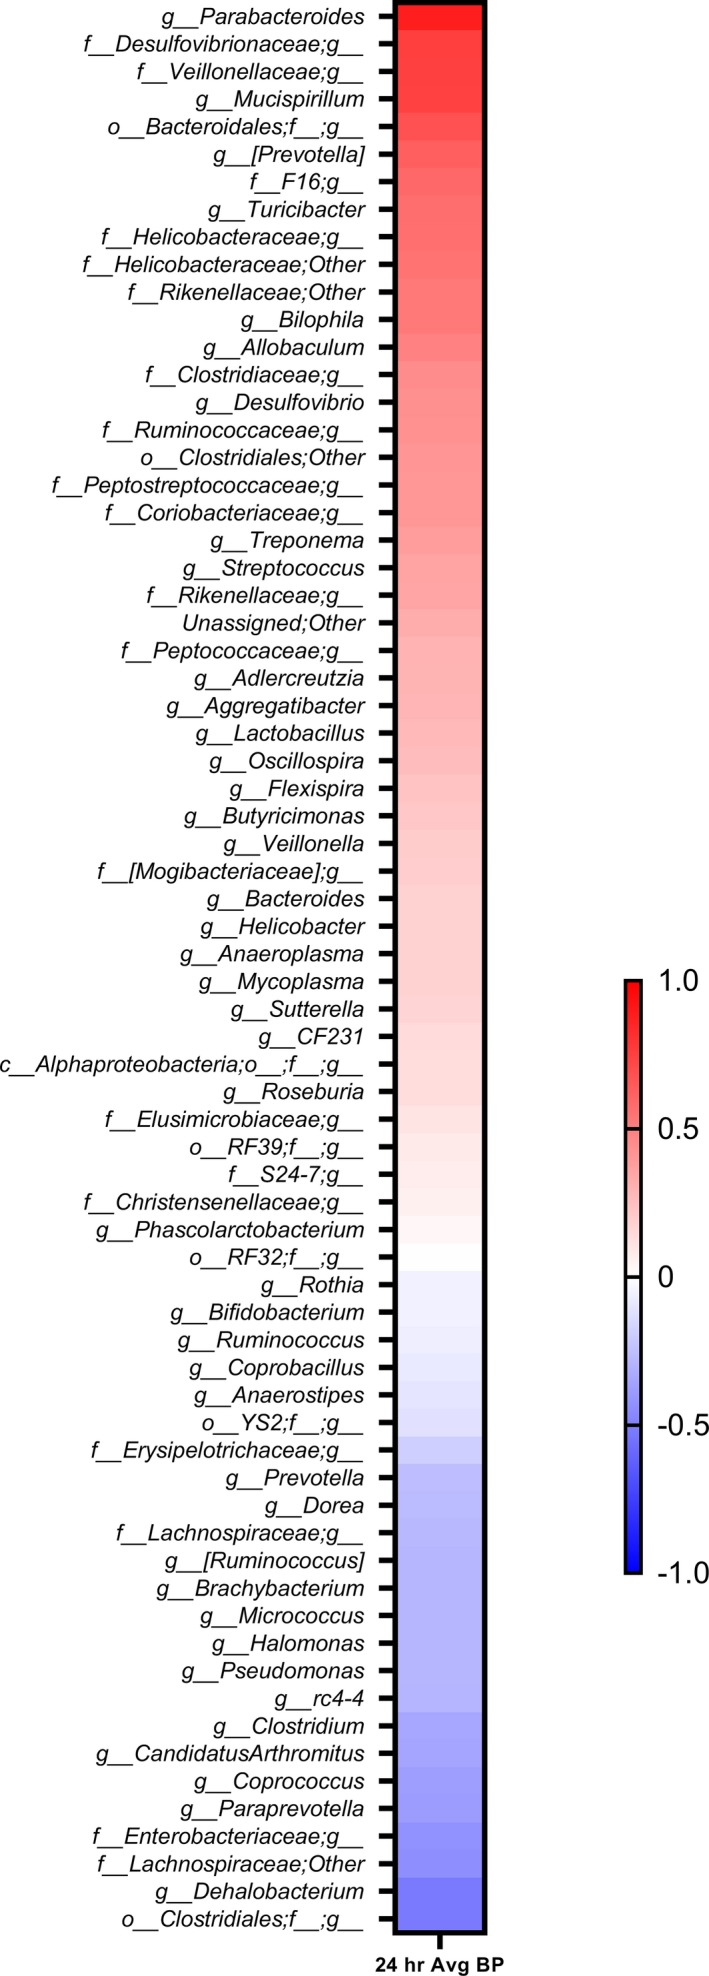
Figure 9.

Correlation between microbiota and systolic BP in the offspring of study 2. Bacterial abundance data obtained from fecal samples of offspring from dams raised with or without amoxicillin were plotted against their 24‐hour systolic BP data. The resultant Spearman correlations are arranged in a red‐blue gradient scale; blue color indicates negative correlation, red color indicates positive correlation, and white color indicates no correlation with BP. A red‐blue gradient scale; blue color indicates negative correlation, and red color indicates positive correlation. BP indicates blood pressure.
