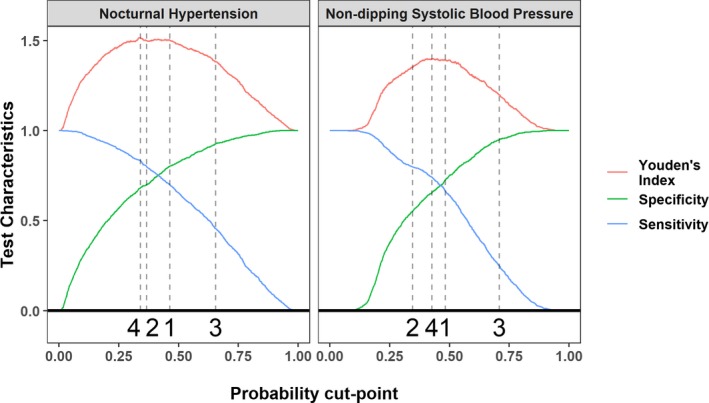
Figure 3.

Sensitivity, specificity, and Youden index of the nocturnal hypertension and nondipping systolic blood pressure predictive equations. Results are based on the derivation data. Probability cut points selected for validation (bottom of each panel): (1) Closest number of predicted and observed cases with nocturnal hypertension and nondipping systolic blood pressure. (2) The maximum specificity with a sensitivity ≥0.80. (3) The maximum negative predictive value with a positive predictive value ≥0.80. (4) The maximum sum of sensitivity and specificity.
