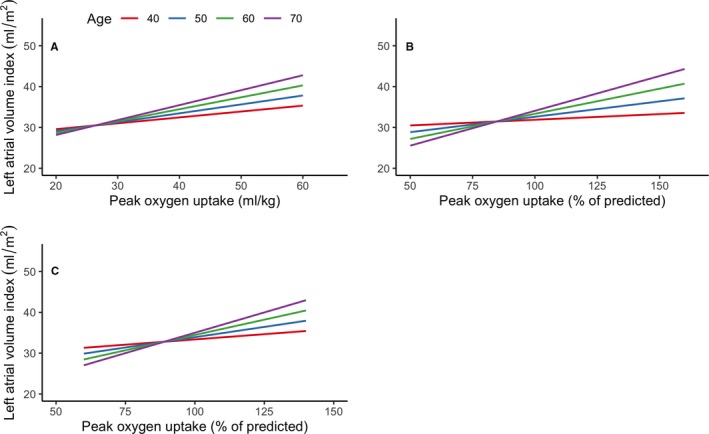
Figure 3.

Prediction diagrams of left atrial volume index for ages 40, 50, 60, and 70 years by peak oxygen uptake (VO2peak) (n=229) (A), percentage of age‐ and sex‐predicted VO 2peak (n=229) (B), and percentage of age‐ and sex‐predicted VO 2peak in men only (n=103) (C).
