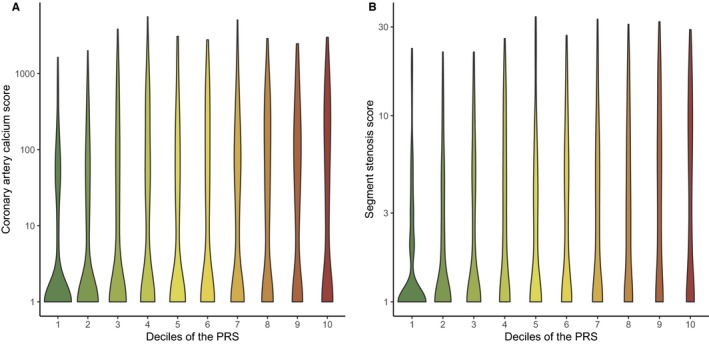
Figure 2.

Violin plots displaying the distribution of coronary artery calcium score (A) and segment stenosis score (B) across the deciles of the PRS (n=1645 patients). A log scale was used for the y‐axis for display purposes. All values were transformed as loge (value + 1). PRS indicates polygenic risk score.
