
Figure 3.
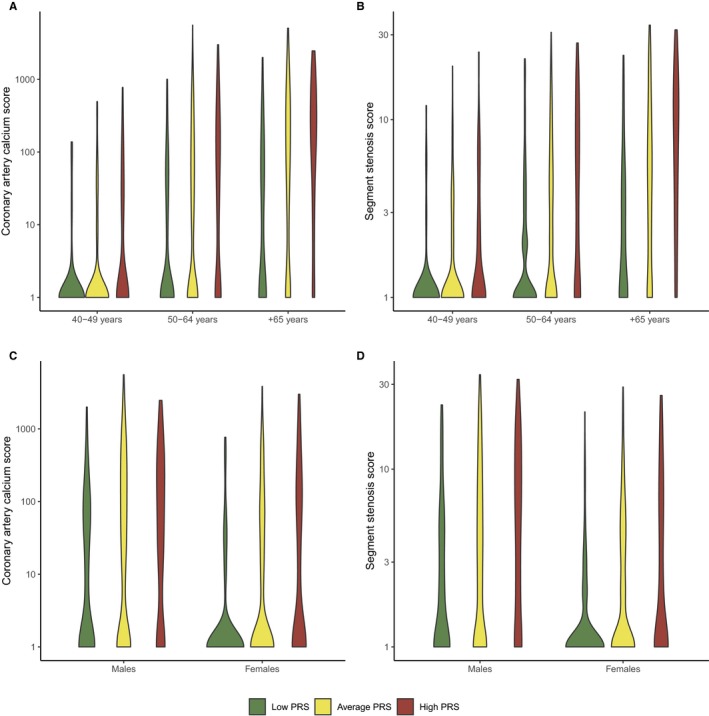
Violin plots displaying the distribution of coronary artery calcium score (A and C) and segment stenosis score (B and D) according to the PRS stratified by age and sex (n=1645 patients). Patients were categorized as low‐ (<20th percentile), average‐ (20th to 80th percentile), or high PRS (>80th percentile). A log scale was used for the y‐axis for display purposes. All values were transformed as loge (value + 1). PRS indicates polygenic risk score.