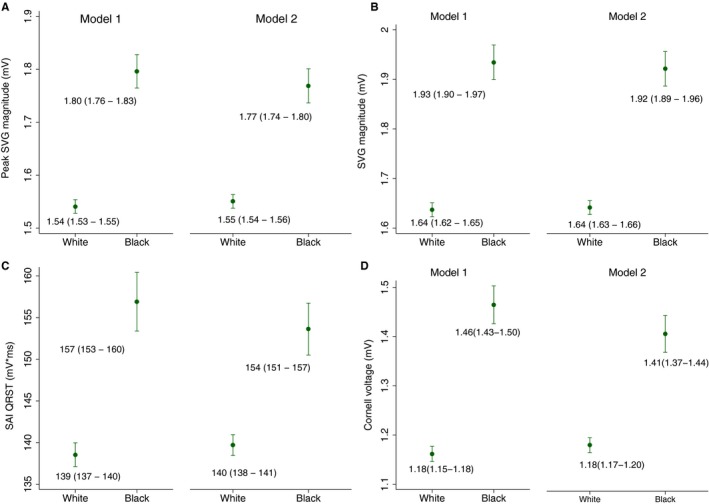
Figure 2.

Estimated adjusted marginal (least‐squares) means and 95% CIs of peak spatial ventricular gradient (SVG) magnitude (A), area SVG magnitude (B), sum absolute QRST integral (SAI QRST) (C), and Cornell voltage (D) for white and black participants. Model 1 was adjusted for age, sex, and study center. Model 2 was additionally adjusted for heart failure, coronary heart disease, stroke, diabetes mellitus, hypertension, current smoking and alcohol intake, work, sport, and leisure physical activity levels, levels of total cholesterol, high‐density lipoprotein, and triglycerides, body mass index, use of antihypertensive and antiarrhythmic medications, serum concentrations of sodium, potassium, calcium, magnesium, phosphorus, and uric acid, total protein and albumin, blood urea nitrogen, and chronic kidney disease stage classified by estimated glomerular filtration rate (calculated using the Chronic Kidney Disease–Epidemiology Collaboration equation), heart rate, QRS duration, Bazett‐corrected QT interval, Cornell voltage, education level, occupation category, income, and health insurance.
