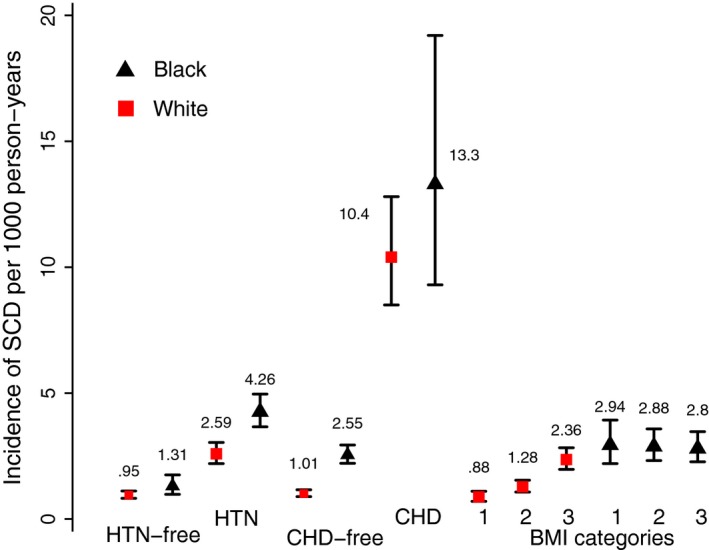
Figure 3.

Incidence of sudden cardiac death (SCD) per 1000 person‐years in black (black triangles) and white (red quadrants) participants with and without hypertension (HTN) and coronary heart disease (CHD), and by body mass index (BMI) subgroups. Black lines correspond to 95% CI bounds.
