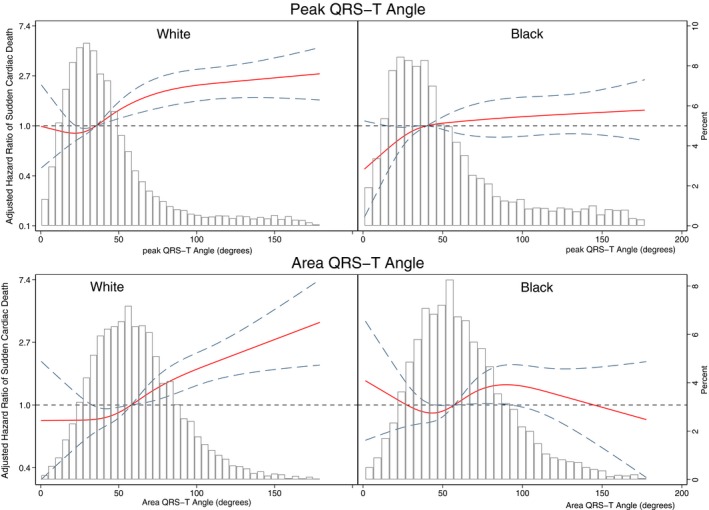
Figure 7.

Adjusted (model 1, as described in Figure 4 legend) risk of sudden cardiac death associated with area and peak QRS‐T angle in black and white participants. Restricted cubic spline with 95% CI shows a change in the hazard ratio (y axis) in response to QRS‐T angle change (x axis). The 50th percentile of QRS‐T angle is selected as a reference. Knots of peak QRS‐T angle in white participants are at 10° to 28° to 44° to 118°, and in black participants are at 11° to 31° to 53° to 149°. Knots of area QRS‐T angle in white participants are at 22° to 48° to 69° to 112°, and in black participants are at 21° to 48° to 69° to 118°.
