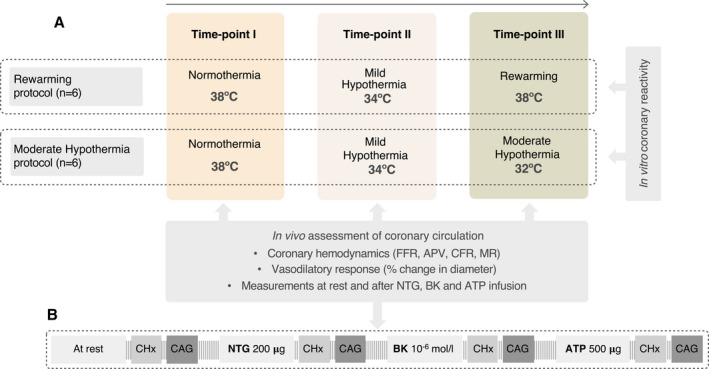
Figure 1.

Flow chart illustrating study design with the assessments performed at each temperature time point (A) and the protocol of intracoronary drug administration (B). APV indicates average peak velocity; CAG, coronary angiography; CFR, coronary flow reserve; CHx, coronary hemodynamics; FFR fractional flow reserve; MR, microvascular resistance.
