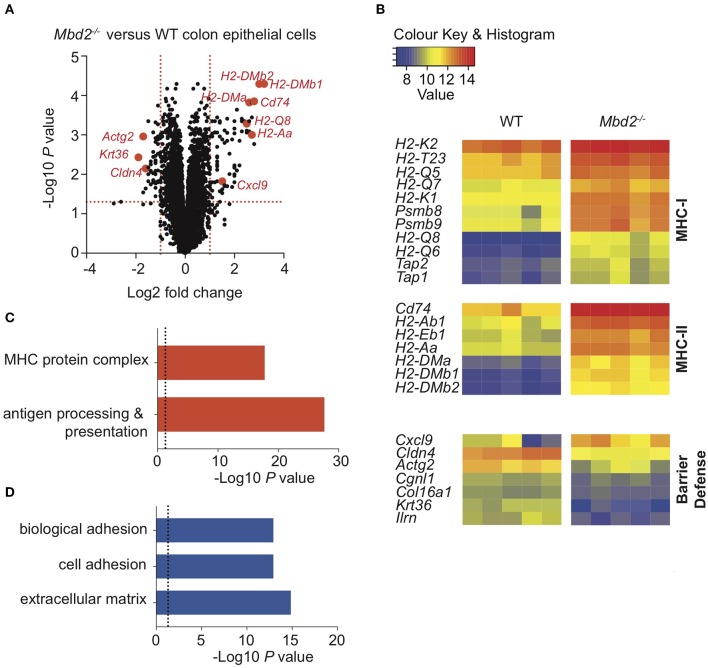
Figure 5.
The impact of Mbd2 deficiency on mRNA expression by colon epithelial cells during colitis. (A) Volcano plot depicts differential gene expression profile of mRNA as determined by microarray of colon epithelial cells (CD45− Lin− F4/80− CD3− EpCAM+) isolated by flow cytometry after 6 consecutive days DSS treatment in Mbd2−/− or WT littermate co-housed mice. (B) Heat map of relative gene expression values from selected significant (log2 fold change ± 1, P < 0.05) loci and selected up (C) and down (D) (P < 0.05) pathways from GOterm analysis from (A) (log2 normalized intensity, one-fold change-filtered, P < 0.05), 5 biological replicates per genotype.

