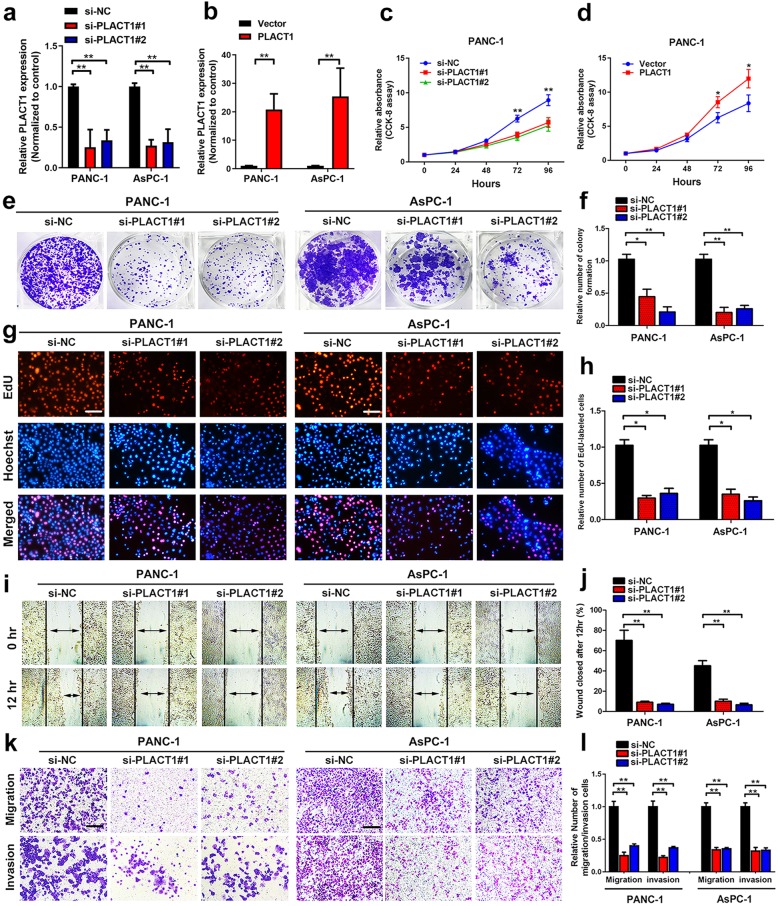
Fig. 2.
PLACT1 promotes proliferation, migration, and invasion of PDAC cells. a-b, Efficiencies of PLACT1 knockdown (a) and overexpression (b) in PANC-1 and AsPC-1 cells were verified by qRT-PCR assays. c-d The cell viability of si-PLACT1-transfected (c) or PLACT1-cDNA-transfected (d) PANC-1 cells by CCK-8 assays. e-f Effect of PLACT1 knockdown on colony formation was counted in PANC-1 and AsPC-1 cells (e). The histogram analysis (f) showed the mean ± SD of colonies from three independent experiments. g-h Representative images (g) and histogram analysis (h) of EdU assays after PLACT1 knockdown in PANC-1 and AsPC-1 cells. i-j Representative images (i) and histogram analysis (j) of wound healing assays after PLACT1 knockdown in PANC-1 and AsPC-1 cells. k-l Representative images (k) and histogram analysis (l) of Transwell assays after PLACT1 knockdown in PANC-1 and AsPC-1 cells. Scale bars: 100 μm. Significance level was assessed using two-tailed t-tests and one-way analysis of variance (ANOVA) followed by Dunnett’s tests for multiple comparison. Figures with error bars show standard deviations of three independent experiments. *p < 0.05 and **p < 0.01

