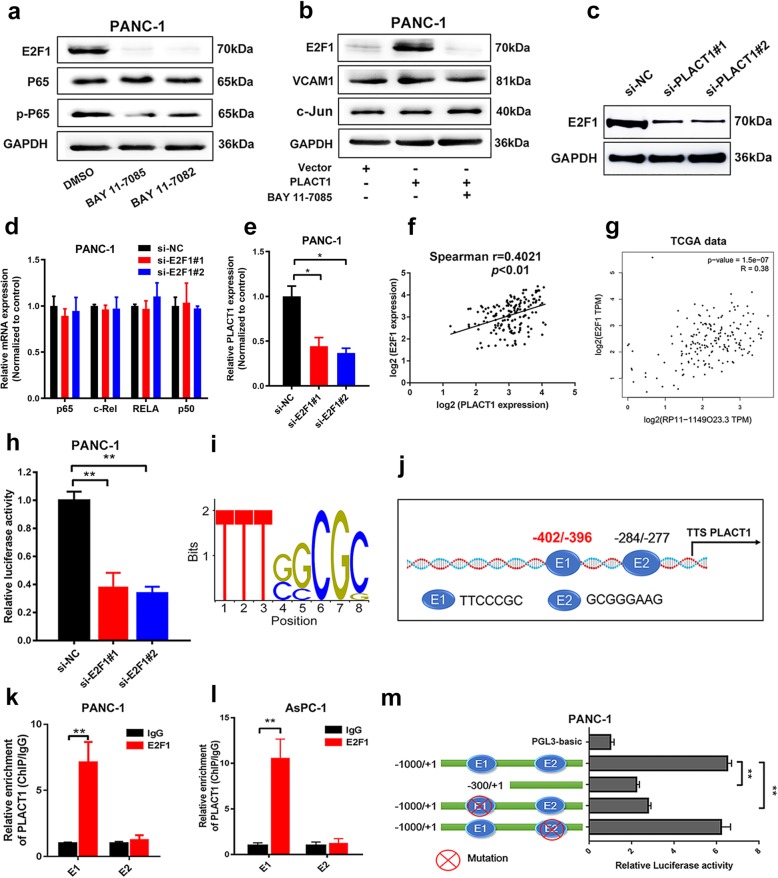
Fig. 8.
PLACT1 sustains NF-κB pathway activation by forming a positive feedback loop with E2F1. a Western blotting analysis revealed that BAY 11–7085 and BAY 11–7082 decreased E2F1 and p-p65 expression. BAY 11–7085 and BAY 11–7082 are NF-κB inhibitors. b Western blotting analysis showed that BAY 11–7085 was used in PLACT1-overexpressing cells, and the levels of E2F1, VCAM1, and C-Jun were measured after 72 h. c The expression of E2F1 after PLACT1 knockdown in PDAC cells was assessed by western blotting analysis. d qRT-PCR assays showed that E2F1 depletion failed to influence the expression of P65, c-Rel, RELB, and P50 in PANC-1 cells. e E2F1 depletion reduced expression of PLACT1 in PANC-1 cells as detected by qRT-PCR. f-gPLACT1 was positively correlated with E2F1 in PDAC tissues evaluated by our data (f, n = 166) and TCGA data (g, n = 179). h Luciferase reporter assays showed that E2F1 knockdown reduced the transcriptional activity of PLACT1 promoter in PANC-1 cells. i Enriched motifs of E2F1 binding sites predicted by JASPAR (http://jaspar.binf.ku.dk/). j Schematic model of predicted E2F1 binding sequences in the PLACT1 promoter region. k-l ChIP-qPCR assays were evaluated in PANC-1 (k) and AsPC-1 (l) cells. m Luciferase reporter assays showing that depletion of E1 downregulated the transcriptional activity of PLACT1 promoter in PANC-1 cells. Statistical significance was evaluated by using two-tailed t-tests and ANOVA, followed by Dunnett’s tests for multiple comparison. The error bars represent standard deviations of three independent experiments. *p < 0.05 and **p < 0.01

